In randomized, double-blind clinical trials of a new vaccine, infants were randomly divided into two groups. Subjects in group 1 received the new vaccine while subjects in group 2 received a control vaccine. After the second dose, 129 of 674 subjects in the experimental group (group 1) experienced drowsiness as a side effect. After the second dose, 86 of 555 of the subjects in the control group (group 2) experienced drowsiness as a side effect. Does the evidence suggest that a higher proportion of subjects in group 1 experienced drowsiness as a side effect than subjects in group 2 at the a = 0.10 level of significance? Verify the model requirements. Select all that apply. A. The samples are independent. O B. The sample size is more than 5% of the population size for each sample. O c. The data come from a population that is normally distributed. O D. The samples are dependent. YE. The sample size is less than 5% of the population size for each sample. nPi (1-P1) 2 10 and nz2(1-P2) 2 10 Determine the null and alternative hypotheses. Ho: P1 = P2 H: P1 > P2 Find the test statistic for this hypothesis test. 1.67 (Round to two decimal places as needed.) Determine the P-value for this hypothesis test. DRound to throo donimnl ninon
In randomized, double-blind clinical trials of a new vaccine, infants were randomly divided into two groups. Subjects in group 1 received the new vaccine while subjects in group 2 received a control vaccine. After the second dose, 129 of 674 subjects in the experimental group (group 1) experienced drowsiness as a side effect. After the second dose, 86 of 555 of the subjects in the control group (group 2) experienced drowsiness as a side effect. Does the evidence suggest that a higher proportion of subjects in group 1 experienced drowsiness as a side effect than subjects in group 2 at the a = 0.10 level of significance? Verify the model requirements. Select all that apply. A. The samples are independent. O B. The sample size is more than 5% of the population size for each sample. O c. The data come from a population that is normally distributed. O D. The samples are dependent. YE. The sample size is less than 5% of the population size for each sample. nPi (1-P1) 2 10 and nz2(1-P2) 2 10 Determine the null and alternative hypotheses. Ho: P1 = P2 H: P1 > P2 Find the test statistic for this hypothesis test. 1.67 (Round to two decimal places as needed.) Determine the P-value for this hypothesis test. DRound to throo donimnl ninon

Holt Mcdougal Larson Pre-algebra: Student Edition 2012
1st Edition
ISBN:9780547587776
Author:HOLT MCDOUGAL
Publisher:HOLT MCDOUGAL
Chapter11: Data Analysis And Probability
Section: Chapter Questions
Problem 8CR

Related questions

Question
100%
just the p value thank you
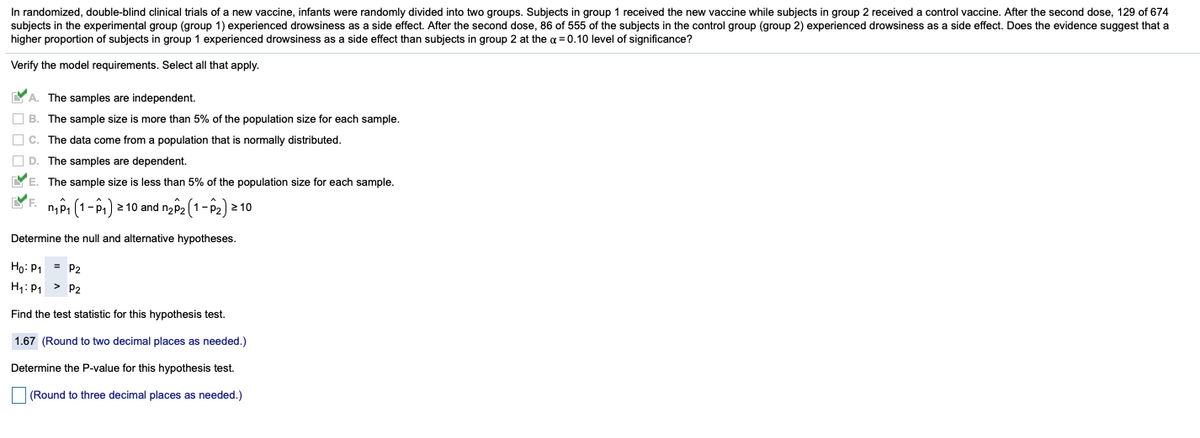
Transcribed Image Text:In randomized, double-blind clinical trials of a new vaccine, infants were randomly divided into two groups. Subjects in group 1 received the new vaccine while subjects in group 2 received a control vaccine. After the second dose, 129 of 674
subjects in the experimental group (group 1) experienced drowsiness as a side effect. After the second dose, 86 of 555 of the subjects in the control group (group 2) experienced drowsiness as a side effect. Does the evidence suggest that a
higher proportion of subjects in group 1 experienced drowsiness as a side effect than subjects in group 2 at the a = 0.10 level of significance?
Verify the model requirements. Select all that apply.
YA. The samples are independent.
O B. The sample size is more than 5% of the population size for each sample.
O c. The data come from a population that is normally distributed.
O D. The samples are dependent.
YE. The sample size is less than 5% of the population size for each sample.
nội (1-P1) 2 10 and nz2 (1- P2) 2 10
F.
Determine the null and alternative hypotheses.
Họ: P1 = P2
H: P1 > P2
Find the test statistic for this hypothesis test.
1.67 (Round to two decimal places as needed.)
Determine the P-value for this hypothesis test.
|(Round to three decimal places as needed.)
Expert Solution
This question has been solved!
Explore an expertly crafted, step-by-step solution for a thorough understanding of key concepts.

This is a popular solution!

Trending now
This is a popular solution!

Step by step
Solved in 2 steps

Knowledge Booster


Learn more about
Need a deep-dive on the concept behind this application? Look no further. Learn more about this topic, statistics and related others by exploring similar questions and additional content below.Recommended textbooks for you
Holt Mcdougal Larson Pre-algebra: Student Edition…
Algebra
ISBN:
9780547587776
Author:
HOLT MCDOUGAL
Publisher:
HOLT MCDOUGAL

College Algebra (MindTap Course List)
Algebra
ISBN:
9781305652231
Author:
R. David Gustafson, Jeff Hughes
Publisher:
Cengage Learning

Holt Mcdougal Larson Pre-algebra: Student Edition…
Algebra
ISBN:
9780547587776
Author:
HOLT MCDOUGAL
Publisher:
HOLT MCDOUGAL
College Algebra (MindTap Course List)
Algebra
ISBN:
9781305652231
Author:
R. David Gustafson, Jeff Hughes
Publisher:
Cengage Learning