In randomized, double-blind clinical trials of a new vaccine, monkeys were randomly divided into two groups. Subjects subjects jn group 2 received a control vaccine. After the second dose, 118 of 704 subjects in the experimental group (group 1) experienced drowsiness as a si effect. After the second dose, 75 of 585 of the subjects in the control group (group 2) experienced drowsiness as a side effect. Does the evidence suggest tha higher proportion of subjects in group 1 experienced drowsiness as a side effect than subjects in group 2 at the a = 0.10 level of significance? Verify the model requirements. Select all that apply. CA. The data come from a population that is normally distributed. YB. The samples are independent. OC. The sample size is more than 5% of the population size for each sample. D. The samples are dependent. E. The sample size is less than 5% of the population size for each sample. 210 and N2P2 (1-P2) 2 10 Delemine lie null and allenalive lıypolliesses. Ho P1 P2 H:P1 P2
In randomized, double-blind clinical trials of a new vaccine, monkeys were randomly divided into two groups. Subjects subjects jn group 2 received a control vaccine. After the second dose, 118 of 704 subjects in the experimental group (group 1) experienced drowsiness as a si effect. After the second dose, 75 of 585 of the subjects in the control group (group 2) experienced drowsiness as a side effect. Does the evidence suggest tha higher proportion of subjects in group 1 experienced drowsiness as a side effect than subjects in group 2 at the a = 0.10 level of significance? Verify the model requirements. Select all that apply. CA. The data come from a population that is normally distributed. YB. The samples are independent. OC. The sample size is more than 5% of the population size for each sample. D. The samples are dependent. E. The sample size is less than 5% of the population size for each sample. 210 and N2P2 (1-P2) 2 10 Delemine lie null and allenalive lıypolliesses. Ho P1 P2 H:P1 P2

Holt Mcdougal Larson Pre-algebra: Student Edition 2012
1st Edition
ISBN:9780547587776
Author:HOLT MCDOUGAL
Publisher:HOLT MCDOUGAL
Chapter11: Data Analysis And Probability
Section: Chapter Questions
Problem 8CR

Related questions

Concept explainers
Contingency Table
A contingency table can be defined as the visual representation of the relationship between two or more categorical variables that can be evaluated and registered. It is a categorical version of the scatterplot, which is used to investigate the linear relationship between two variables. A contingency table is indeed a type of frequency distribution table that displays two variables at the same time.
Binomial Distribution
Binomial is an algebraic expression of the sum or the difference of two terms. Before knowing about binomial distribution, we must know about the binomial theorem.
Topic Video
Question
100%
Solve the 2nd question please
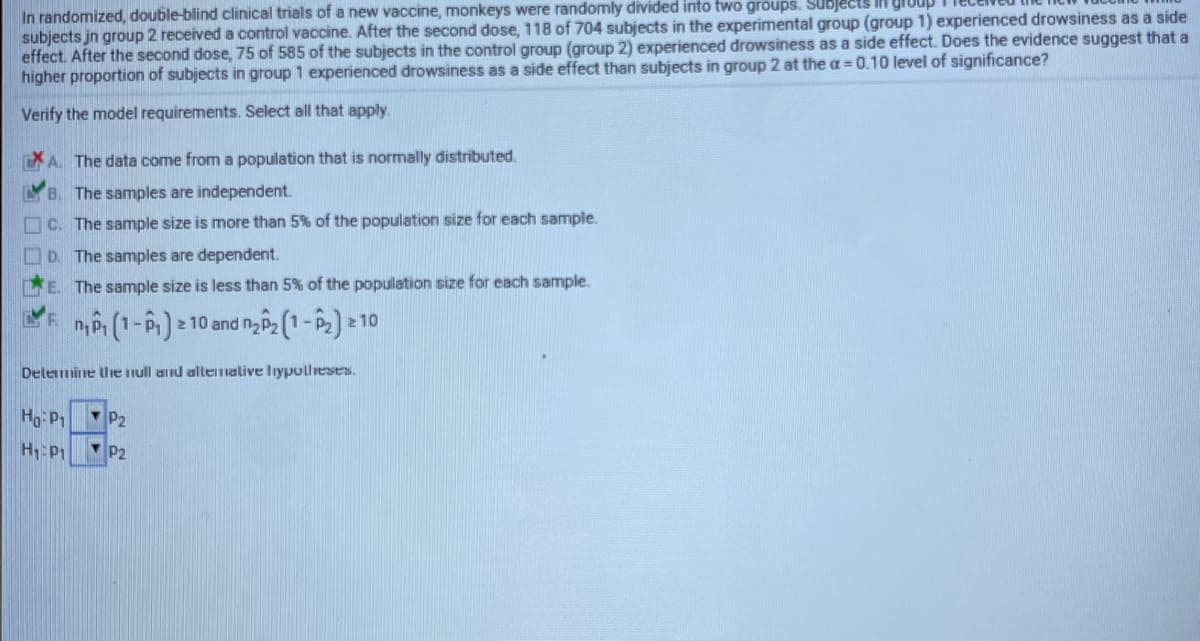
Transcribed Image Text:In randomized, double-blind clinical trials of a new vaccine, monkeys were randomly divided into two groups. Subjects
subjects jn group 2 received a control vaccine. After the second dose, 118 of 704 subjects in the experimental group (group 1) experienced drowsiness as a side
effect. After the second dose, 75 of 585 of the subjects in the control group (group 2) experienced drowsiness as a side effect. Does the evidence suggest that a
higher proportion of subjects in group 1 experienced drowsiness as a side effect than subjects in group 2 at the a= 0.10 level of significance?
Verify the model requirements. Select all that apply.
CA. The data come from a population that is normally distributed.
YB. The samples are independent.
OC. The sample size is more than 5% of the population size for each sample.
D. The samples are dependent.
E. The sample size is less than 5% of the population size for each sample.
210 and N2P2 (1-P2) 2 10
Delemine Uie null and allemalive lıypolliesses.
Ho P1
P2
H:P1
P2
Expert Solution
This question has been solved!
Explore an expertly crafted, step-by-step solution for a thorough understanding of key concepts.

This is a popular solution!

Trending now
This is a popular solution!

Step by step
Solved in 2 steps with 1 images

Knowledge Booster


Learn more about
Need a deep-dive on the concept behind this application? Look no further. Learn more about this topic, statistics and related others by exploring similar questions and additional content below.Recommended textbooks for you
Holt Mcdougal Larson Pre-algebra: Student Edition…
Algebra
ISBN:
9780547587776
Author:
HOLT MCDOUGAL
Publisher:
HOLT MCDOUGAL

Holt Mcdougal Larson Pre-algebra: Student Edition…
Algebra
ISBN:
9780547587776
Author:
HOLT MCDOUGAL
Publisher:
HOLT MCDOUGAL