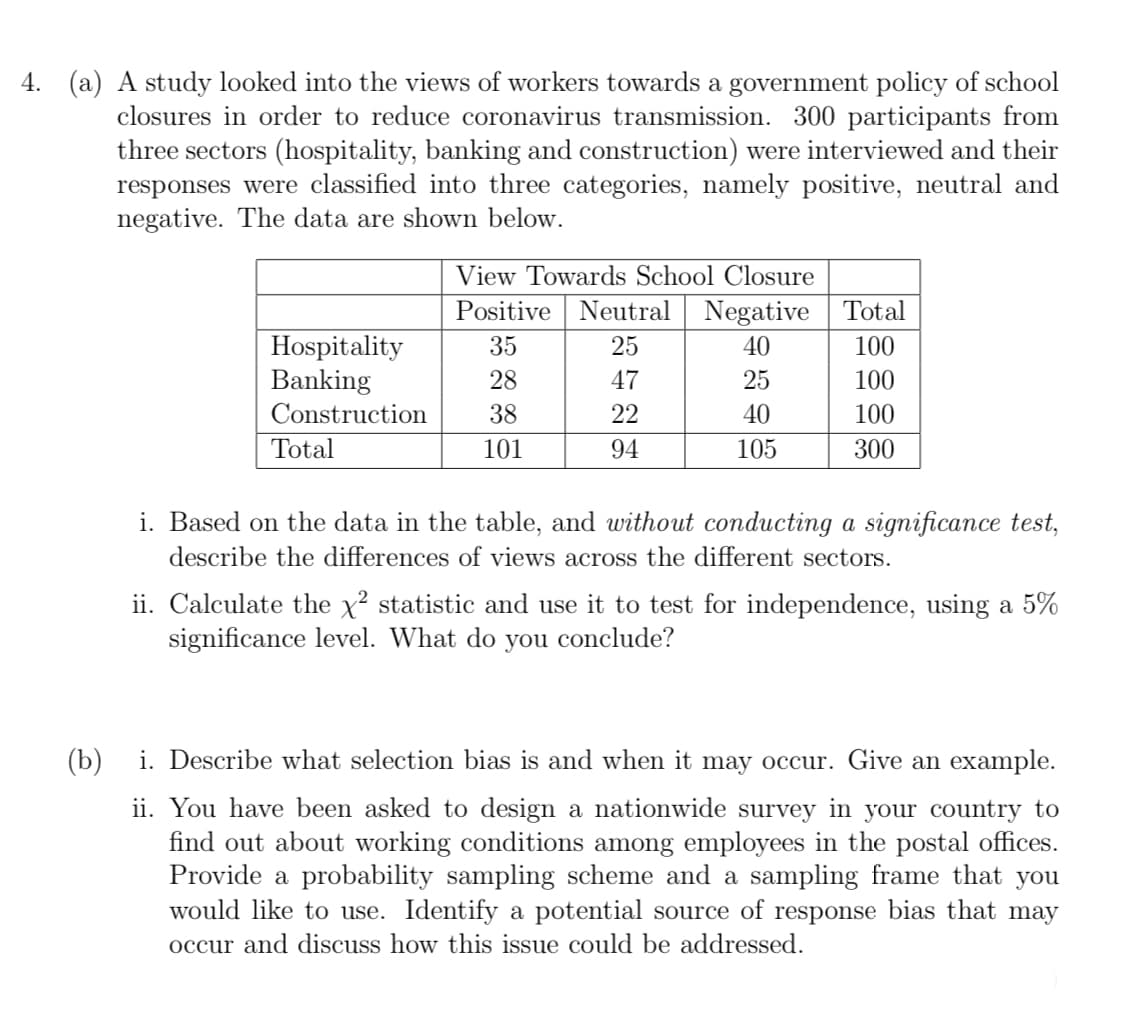
(a) A study looked into the views of workers towards a government policy of school closures in order to reduce coronavirus transmission. 300 participants from three sectors (hospitality, banking and construction) were interviewed and their responses were classified into three categories, namely positive, neutral and negative. The data are shown below. View Towards School Closure Positive Neutral Negative Total Hospitality Banking Construction 35 25 40 100 28 47 25 100 38 22 40 100 Total 101 94 105 300 i. Based on the data in the table, and without conducting a significance test, describe the differences of views across the different sectors. ii. Calculate the x² statistic and use it to test for independence, using a 5% significance level. What do you conclude?
(a) A study looked into the views of workers towards a government policy of school closures in order to reduce coronavirus transmission. 300 participants from three sectors (hospitality, banking and construction) were interviewed and their responses were classified into three categories, namely positive, neutral and negative. The data are shown below. View Towards School Closure Positive Neutral Negative Total Hospitality Banking Construction 35 25 40 100 28 47 25 100 38 22 40 100 Total 101 94 105 300 i. Based on the data in the table, and without conducting a significance test, describe the differences of views across the different sectors. ii. Calculate the x² statistic and use it to test for independence, using a 5% significance level. What do you conclude?

MATLAB: An Introduction with Applications
6th Edition
ISBN:9781119256830
Author:Amos Gilat
Publisher:Amos Gilat
Chapter1: Starting With Matlab
Section: Chapter Questions
Problem 1P

Related questions

Concept explainers
Contingency Table
A contingency table can be defined as the visual representation of the relationship between two or more categorical variables that can be evaluated and registered. It is a categorical version of the scatterplot, which is used to investigate the linear relationship between two variables. A contingency table is indeed a type of frequency distribution table that displays two variables at the same time.
Binomial Distribution
Binomial is an algebraic expression of the sum or the difference of two terms. Before knowing about binomial distribution, we must know about the binomial theorem.
Topic Video
Question
Transcribed Image Text:4. (a) A study looked into the views of workers towards a government policy of school
closures in order to reduce coronavirus transmission. 300 participants from
three sectors (hospitality, banking and construction) were interviewed and their
responses were classified into three categories, namely positive, neutral and
negative. The data are shown below.
View Towards School Closure
Positive Neutral Negative Total
Hospitality
Banking
Construction
35
25
40
100
28
47
25
100
38
22
40
100
Total
101
94
105
300
i. Based on the data in the table, and without conducting a significance test,
describe the differences of views across the different sectors.
ii. Calculate the x? statistic and use it to test for independence, using a 5%
significance level. What do you conclude?
(b)
i. Describe what selection bias is and when it may occur. Give an example.
ii. You have been asked to design a nationwide survey in your country to
find out about working conditions among employees in the postal offices.
Provide a probability sampling scl
would like to use. Identify a potential source of response bias that may
me and a sampling frame that you
occur and discuss how this issue could be addressed.
Expert Solution
This question has been solved!
Explore an expertly crafted, step-by-step solution for a thorough understanding of key concepts.

This is a popular solution!

Trending now
This is a popular solution!

Step by step
Solved in 2 steps with 3 images

Knowledge Booster


Learn more about
Need a deep-dive on the concept behind this application? Look no further. Learn more about this topic, statistics and related others by exploring similar questions and additional content below.Recommended textbooks for you
MATLAB: An Introduction with Applications
Statistics
ISBN:
9781119256830
Author:
Amos Gilat
Publisher:
John Wiley & Sons Inc

Probability and Statistics for Engineering and th…
Statistics
ISBN:
9781305251809
Author:
Jay L. Devore
Publisher:
Cengage Learning

Statistics for The Behavioral Sciences (MindTap C…
Statistics
ISBN:
9781305504912
Author:
Frederick J Gravetter, Larry B. Wallnau
Publisher:
Cengage Learning
MATLAB: An Introduction with Applications
Statistics
ISBN:
9781119256830
Author:
Amos Gilat
Publisher:
John Wiley & Sons Inc
Probability and Statistics for Engineering and th…
Statistics
ISBN:
9781305251809
Author:
Jay L. Devore
Publisher:
Cengage Learning
Statistics for The Behavioral Sciences (MindTap C…
Statistics
ISBN:
9781305504912
Author:
Frederick J Gravetter, Larry B. Wallnau
Publisher:
Cengage Learning

Elementary Statistics: Picturing the World (7th E…
Statistics
ISBN:
9780134683416
Author:
Ron Larson, Betsy Farber
Publisher:
PEARSON

The Basic Practice of Statistics
Statistics
ISBN:
9781319042578
Author:
David S. Moore, William I. Notz, Michael A. Fligner
Publisher:
W. H. Freeman

Introduction to the Practice of Statistics
Statistics
ISBN:
9781319013387
Author:
David S. Moore, George P. McCabe, Bruce A. Craig
Publisher:
W. H. Freeman