10. The appropriate p-value to know whether the mean weight loss differs among the three diets is A. 0.0129 B. 0.7671 C. 0.000716 D. 0.683
10. The appropriate p-value to know whether the mean weight loss differs among the three diets is A. 0.0129 B. 0.7671 C. 0.000716 D. 0.683

Glencoe Algebra 1, Student Edition, 9780079039897, 0079039898, 2018
18th Edition
ISBN:9780079039897
Author:Carter
Publisher:Carter
Chapter10: Statistics
Section10.1: Measures Of Center
Problem 9PPS

Related questions
Question
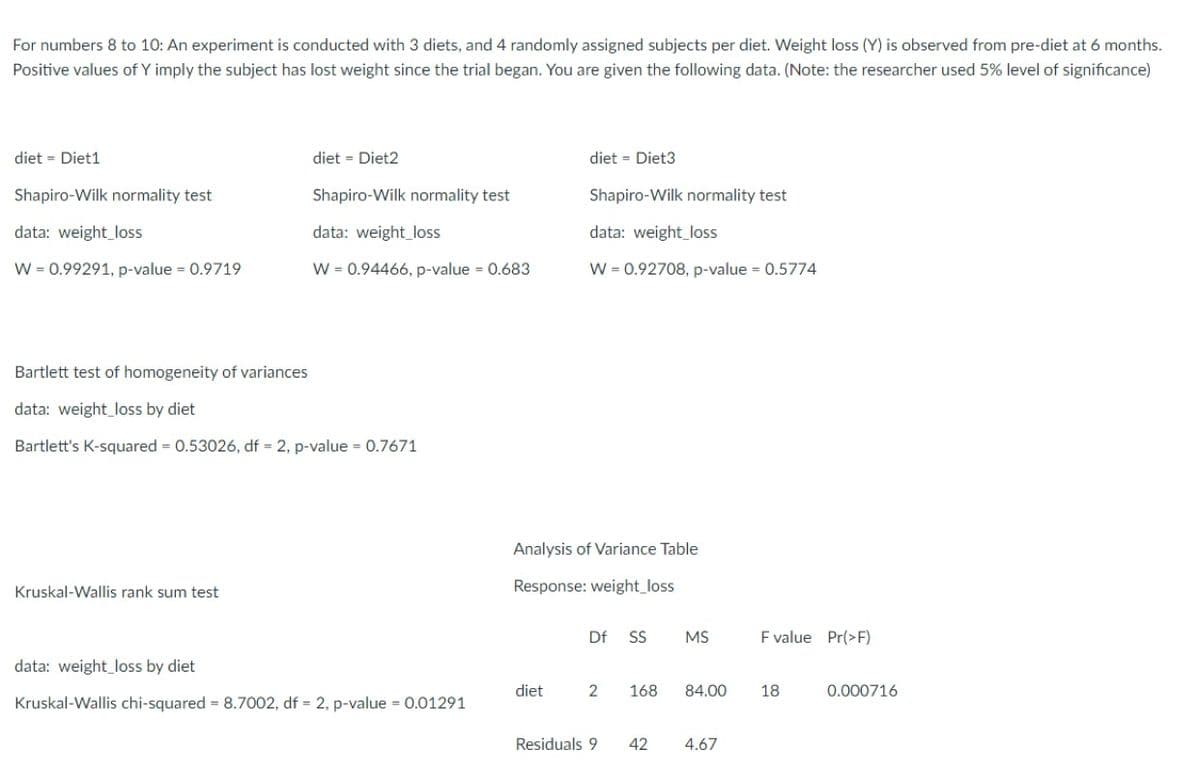
Transcribed Image Text:For numbers 8 to 10: An experiment is conducted with 3 diets, and 4 randomly assigned subjects per diet. Weight loss (Y) is observed from pre-diet at 6 months.
Positive values of Y imply the subject has lost weight since the trial began. You are given the following data. (Note: the researcher used 5% level of significance)
diet = Diet1
Shapiro-Wilk normality test
data: weight loss
W = 0.99291, p-value = 0.9719
diet = Diet2
Kruskal-Wallis rank sum test
Shapiro-Wilk normality test
data: weight loss
W = 0.94466, p-value = 0.683
Bartlett test of homogeneity of variances
data: weight loss by diet
Bartlett's K-squared = 0.53026, df = 2, p-value = 0.7671
data: weight loss by diet
Kruskal-Wallis chi-squared = 8.7002, df = 2, p-value = 0.01291
diet = Diet3
diet
Shapiro-Wilk normality test
data: weight loss
W = 0.92708, p-value = 0.5774
Analysis of Variance Table
Response: weight loss
Df SS MS
2
Residuals 9
168
84.00
42 4.67
F value Pr(>F)
18
0.000716
Transcribed Image Text:10. The appropriate p-value to know whether the mean weight loss differs among the three diets is
A. 0.0129
B. 0.7671
C. 0.000716
D. 0.683
Expert Solution
This question has been solved!
Explore an expertly crafted, step-by-step solution for a thorough understanding of key concepts.

Step by step
Solved in 2 steps

Follow-up Questions
Read through expert solutions to related follow-up questions below.
Follow-up Question
Which of the following is/are TRUE at 5% level of significance?
I. We can assume independence of errors since the subjects were randomly assigned to one of the three diets.
II. We have sufficient evidence to say that the data are not
A. I only
B. II only
C. Both I and II
D. Neither I nor II
Solution
Follow-up Question
In testing whether the variances among treatments are equal at 5% level of significance, we have _____ evidence to say that the variances are NOT equal (p-value= _____).
A. suffcient, 0.01291
B. sufficient, 0.000716
C. insufficient, 0.53026
D. insufficient, 0.7671
Solution
Recommended textbooks for you
Glencoe Algebra 1, Student Edition, 9780079039897…
Algebra
ISBN:
9780079039897
Author:
Carter
Publisher:
McGraw Hill
Glencoe Algebra 1, Student Edition, 9780079039897…
Algebra
ISBN:
9780079039897
Author:
Carter
Publisher:
McGraw Hill