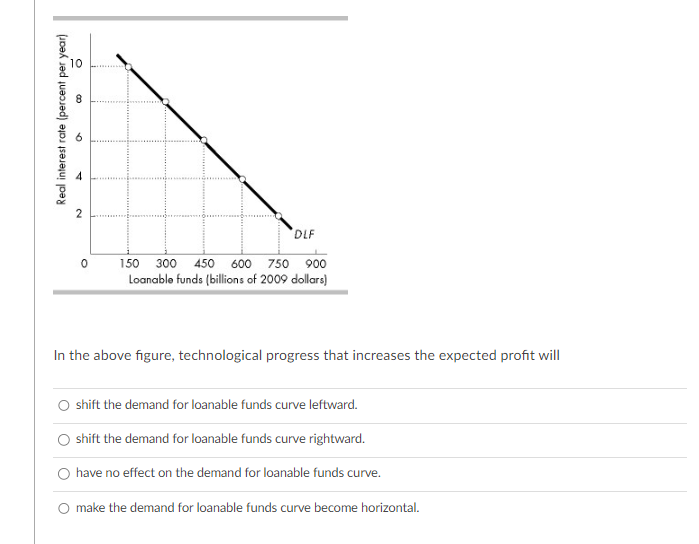
In the above figure, technological progress that increases the expected profit will O shift the demand for loanable funds curve leftward. O shift the demand for loanable funds curve rightward. O have no effect on the demand for loanable funds curve. O make the demand for loanable funds curve become horizontal.
Q: Real GDP is $2,000 billion, the GDP deflator is 120 (a price level of 1.2), and the velocity of…
A: Real GDP is $2000 billion. The GDP deflator is 120. The velocity of circulation is 5.
Q: What is the primary cause of booms and busts in a market economy with a central bank?
A: Boom and bust refer to a cycle of economic expansion and contraction. A "boom" is a period of…
Q: Consider two firms competing to sell a homogeneous product by setting price. The inverse demand…
A: There are two firms competitive to sell a homogenous product by setting prices. The inverse demand…
Q: Explain why monopoly means less social welfare. Is there any kind of price discrimination that does…
A: Monopolist: A monopolist is a single seller in the market and hence he faces the downward sloping…
Q: Use the table below to answer the following questions. Table 3.1.1 Year Coffee Price 2012 2013 2014…
A: Relative price refers to the price of one good or services in terms of another. The term relative…
Q: 7. Why are economists only interested in the spending on U.S. goods and services?
A: Economists aren't only interested in the spending on U.S. goods and services. But, the united states…
Q: Explain why the Leontief paradox and the more recent Bowen, Leamer, and Sveikauskas results reported…
A: Since you have asked multiple question, we will solve the first question for you. If you want any…
Q: When a country specializes in the production of a good, this means that it can produce this good at…
A: Comparative advantage refers to the ability of the country to produce more of the good at a lower…
Q: 1- Assume all firms operating in a competitive market have the following total cost function:< TC =…
A: To solve for (d) , (e) , (f) we will require equilibrium price and quantity . Equilibrium level :…
Q: QUESTION 13 Consider the following extensive form of the game. There are two players. If Player 2…
A: Nash equilibrium is the point of a game corresponding to which each participant optimizes his…
Q: Aggregate Demand I Work It Out Question 1 In the Keynesian cross model, assume that the consumption…
A: According to Keynesian economics, an economy's main driver is aggregate demand, or the total amount…
Q: (a) Consider the action profile where all three parties choose xm 1. Is (1) a Nash equilibrium?…
A: In game theory, a Nash equilibrium is a collection of strategies, one for each participant in a…
Q: Consider the model of a vertical market shown in class. Suppose that the supplier sells each unit to…
A: The retailer's profit-maximization problem can be formulated as: max (p - pc)q - ⲫ[(p-pc)q - (p-pc)q…
Q: The budget deficit function BD for a country is given as: BD(Y)=G+iD-T(Y) where G is government…
A: Budget deficit occurs when the government spending (expenditure, subsidies) surpasses the income or…
Q: How do I determine the profits you earn from second degree price discrminationstrategy and how much…
A: First purchase price- $16 Additional Purchase price- $12
Q: Complete the following sentence. Marginal cost Select one: A. remains constant. B. is the…
A: Total cost is the cost of producing all the units of good. Marginal cost is the cost of producing an…
Q: When a foreign company engages in riskier behavior after it has received international investment…
A: international investment refers to the cross-border flow of capital, technology, and different…
Q: Rochelle is the manager of a firm that sells its product in a monopolistically competitive market…
A: Demand curve is the downward sloping curve. Total revenue is the product of price and quantity.…
Q: A distribution company purchases two parts from the same supplier. When the company places an order…
A: For Product I: The demand during the lead time is: d = 500 * 4 = 2000 units The safety stock…
Q: True or False: If a firm is operating in a contestable market, it should operate at the efficient…
A: A Contestable market refers to a market in which there is a freedom of entry and exit form the…
Q: The Rule of 70 is used to Select one: O A. calculate the standard of living. B. estimate how much of…
A: The rule of 70 is a mathematical shortcut that gives a smooth way to estimate how long it will take…
Q: Suppose you are given the following information for the country Lusitania: Population; total in…
A: Real GDP: GDP or Gross Domestic Product refers to the final value of all goods and services produced…
Q: This question addresses the impact of saving on an economy by examining what happens if tax laws…
A: Since you have asked multiple questions, we will solve the first question for you. If you want any…
Q: Draw a diagram of GDP growth, inflation, and unemployment changing over time during a recession.…
A: The GDP growth is the increase in the real GDP of the economy over a given period of time. The real…
Q: Robin consumes two goods X and Y. His utility function is given by U(x, y) = x*y. The price of Good…
A: Optimal consumption bundle: The optimal consumption bundle is such that at that bundle the…
Q: onsider the following diagram, which shows units of labour on the x-axis and units of capital on the…
A: The Isocost line depicts the combinations of capital and labor that can be purchased under a given…
Q: Country A has following facts, 1. The capital stock is about 3 times one year’s GDP 2. About 15% of…
A: This solution calculates the depreciation rate, MPK (Marginal Product of Capital), and (n+g) for a…
Q: Suppose you want to estimate the price elasticity of demand for pizza at the restaurant you manage.…
A: When the price of pizza is $9.99 per pizza, then the demand is 812 pizzas. When the price of pizza…
Q: If good X is represented on the X axis and good Y on the Y axis, what will happen to the budget line…
A: Budget constraints shows the relationship between the two goods , their prices and the income of the…
Q: The following graph plots a short-run Phillips curve for a hypothetical economy. Show the short-run…
A: Short run Philips curve shows inverse relationship between inflation and unemployment. There is a…
Q: Consider the market for pens. Suppose that the number of students with an allergy to pencil erasers…
A: When the cost of production will fall then supply will increase and the supply curve will shift…
Q: Suppose that the marginal benefit of writing a contract is $400 and the marginal cost of that…
A: It is given that the marginal benefit of writing a contract of length to be $400 and marginal cost…
Q: Please compose a nominal GDP table for the price of 20oz, sprite. For the years of 2022-2024,…
A: Product: 20oz Sprite Year: 2022, 2023, 2024 Starting price = $2 Starting Quantity = 500
Q: The following graph displays four demand curves (LL, MM, NN, and OO) that intersect at point A.…
A: Demand means the willingness of a consumer to buy a product or service at a particular price.
Q: Income range Tax rate $15,000 and below 5% 8% $15,001-$30,000 $30,001-$60,000 12% $60,001-$120,000…
A: The meaning of marginal is one additional unit. Marginal tax rate is the percentage of tax that is…
Q: What is the homogeneous-good duopoly Cournot equilibrium if the market demand function is Q=1,600…
A: The profit is maximized where the marginal revenue is equal to the marginal cost. Marginal cost is…
Q: The figure to the right shows an industry composed of a single monopolistic domestic firm. The firm…
A: Dumping is a pricing strategy where a firm sells its products at a lower price in a foreign market…
Q: 1 2 3 34567 4 5 6 8 9 Nominal per capita Luxembourg Norway Qatar Switzerland Denmark Australia…
A: Because of changes in living costs, inflation rates, and currency rates, purchasing power differs…
Q: I am so confused, my computer stated that all three answers are incorrect. Can you assist so that I…
A: I'll try to put it simply the optimal pricing strategy. First we will find out optimal monopoly…
Q: If the CPI was 228 at the end of 2013 and 236 at the end of 2014, what was the inflation rate in…
A: The inflation rate (πt) is the percentage (%) rise in the average prices of a bundle of commodities…
Q: The opportunity cost of holding money increases when the Select one: O A. income of consumers…
A: Opportunity cost refers to the value of the next best alternative use of the resource.
Q: On the diagram to the right, a movement from A to C represents a O A. change in quantity demanded. O…
A: Demand curve is a negatively sloped curve that shows combinations of price and quantity demanded.
Q: The data suggests that global income inequality is greater in PPP terms than in nominal terms. is it…
A: Nominal per capita refers to the measure of a country's economic output or income per person without…
Q: Based on Kate's and Hubert's respective willingness to pay, plot the market demand curve on the…
A: A consumer buys a product only if the consumer's willingness to pay is greater than or equal to the…
Q: Potential GDP is Select one: O A. the same as nominal GDP. OB. equal to real GDP multiplied by the…
A: Gross domestic product (GDP) is the market value of final goods and services produced within the…
Q: Jacob receives an allowance of $6 per week. He spends all his allowance on ice cream cones, $0.50…
A: Jacob spends his allowance on ice cream and cans of lemon fizz. The price of ice cream cones is…
Q: Which of the following government actions is an example of fiscal policy? A. Regulation of…
A: Fiscal policy : Fiscal policy refers to the use of government spending and taxation to influence the…
Q: Native labor demand and supply are given by the following functions: w = 19 - 0.001ED and w = 10 +…
A: The point at which the demand for labor by employers is equal to the supply of labor provided by…
Q: 7. The long-run supply curve in different cost industries The following graph shows the market for…
A: The curve that depicts different quantities of products and services being demanded at various price…
Q: Which one is wrong considering Becker's model of labor supply? A. Makes a distinction…
A: A firm’s willingness to pay for each unit of labor it wishes to hire is shown by the labor demand…
Trending now
This is a popular solution!
Step by step
Solved in 3 steps
- Show the effect on the real interest rate and equilibrium quantity of loanable funds of a decrease in the demand for loanable funds and a smaller decrease in the supply of loanable funds. Draw a demand for loanable funds curve. Label it DLF0. Draw a supply of loanable funds curve. Label it SLF0. Draw a point at the equilibrium real interest rate and quantity of loanable funds. Label it 1. Draw a curve that shows a decrease in the demand for loanable funds. Label it DLF1. Draw a curve that shows a smaller decrease in the supply of loanable funds. Label it SLF1. Draw a point at the new equilibrium real interest rate and quantity of loanable funds. Label it 2.What is the effect of a fall in the real interest rate on the demand for loanable funds? A fall in the real interest rate _______. A. decreases the demand for loanable funds and shifts the demand curve leftward B. decreases the quantity of loanable funds demanded up along the demand curve C. increases the demand for loanable funds and shifts the demand curve rightward D. increases the quantity of loanable funds demanded down along the demand curve Thanks!Supply and demand for loanable funds The following graph shows the market for loanable funds in a closed economy. The upward-sloping orange line represents the supply of loanable funds, and the downward-sloping blue line represents the demand for loanable funds. 01002003004005006007008009001000109876543210INTEREST RATE (Percent)LOANABLE FUNDS (Billions of dollars)Demand Supply is the source of the demand for loanable funds. As the interest rate rises, the quantity of loanable funds demanded . Suppose the interest rate is 4.5%. Based on the previous graph, the quantity of loanable funds supplied is than the quantity of loans demanded, resulting in a of loanable funds. This would encourage lenders to the interest rates they charge, thereby the quantity of loanable funds supplied and the quantity of loanable funds demanded, moving the market toward the equilibrium interest rate of .
- Loanable fund graph- show the result of a fiscal, crowding out and the effect on the supply of loanable fundsWhat is the effect of a fall in the real interest rate on the demand for loanable funds? A fall in the real interest rate _______. A. increases the quantity of loanable funds demanded down along the demand curve B. decreases the quantity of loanable funds demanded up along the demand curve C. decreases the demand for loanable funds and shifts the demand curve leftward D. increases the demand for loanable funds and shifts the demand curve rightwardIn the standard loanable funds market graph, … …an increase in the supply of loanable funds (rightward shift)... Group of answer choices A) none of the other options. B) could be caused by a tax increase for individuals on interest earned from savings accounts. C) would cause an increase in the real interest rate. D) could be caused by a tax break for businesses on investment spending. E) would cause a decrease in the real interest rate.
- Suppose there are two types of investment in the economy: business fixed investment and residential investment. Suppose that loanable fund market is in equilibrium and the government grants an investment tax credit only for business investment. How does this policy affect the supply and demand for loanable funds, the equilibrium interest rate and equilibrium quantity of loanable funds? Use graph to explain your answer._______ raises the equilibrium real interest rate and decreases the equilibrium quantity of loanable funds. A. A decrease in default risk B. An increase in expected future income C. An increase in disposable income D. A decrease in wealthAt an interest rate of 6%, the equilibrium of supply and demand in loanable fund is 3 billion pounds. If the interest rate is 8% households and firms will want to borrow more or less than 3 billion?
- Which of the following shifts the demand for loanable funds curve to the right (increases demand for loanable funds) (CV) Which of the following shifts the demand for loanable funds curve to the right (increases demand for loanable funds) the real interest rate decreases the marginal product of capital decreases the marginal product of capital increases the real interest rate increasesFirst Call Inc. is a cellular phone company. It plans to build an assembly plant that costs $10 million if the real interest rate is 6% a year. If the real interest rate is 5% a year, First Call Inc. will build a larger plant that costs $12 million. And if he real interest rate is 7% a year, First Call will build a smaller plant that costs $8 million. a. Draw a graph of First Call’s demand for loanable funds curve. b. First Call expects its profit from the sale of cellular phones to double next year. If other things remain the same, explain how this increase in expected profit influence it’s demand for loanable fundsThe government of Rwanda eliminates taxes interest income. What happens in their market for loanable funds?Question 29 options:There would be an increase in the amount of loanable funds borrowed.There would be a reduction in the amount of loanable funds borrowed.There would be no change in the amount of loanable funds borrowed.The change in loanable funds is uncertain.