Forty students took a 50 point computer science test. The scores are shown in the stem and leaf plot: Ol1 7 111 1 4 6 210 2 5 8 8 9 312 6 9 414 6 8 510 0 What is the third quartile of the scores? O 41 44 O 39.5 43.5 O 41.5 O O O
Forty students took a 50 point computer science test. The scores are shown in the stem and leaf plot: Ol1 7 111 1 4 6 210 2 5 8 8 9 312 6 9 414 6 8 510 0 What is the third quartile of the scores? O 41 44 O 39.5 43.5 O 41.5 O O O

Glencoe Algebra 1, Student Edition, 9780079039897, 0079039898, 2018
18th Edition
ISBN:9780079039897
Author:Carter
Publisher:Carter
Chapter10: Statistics
Section10.3: Measures Of Spread
Problem 25PFA

Related questions
Question
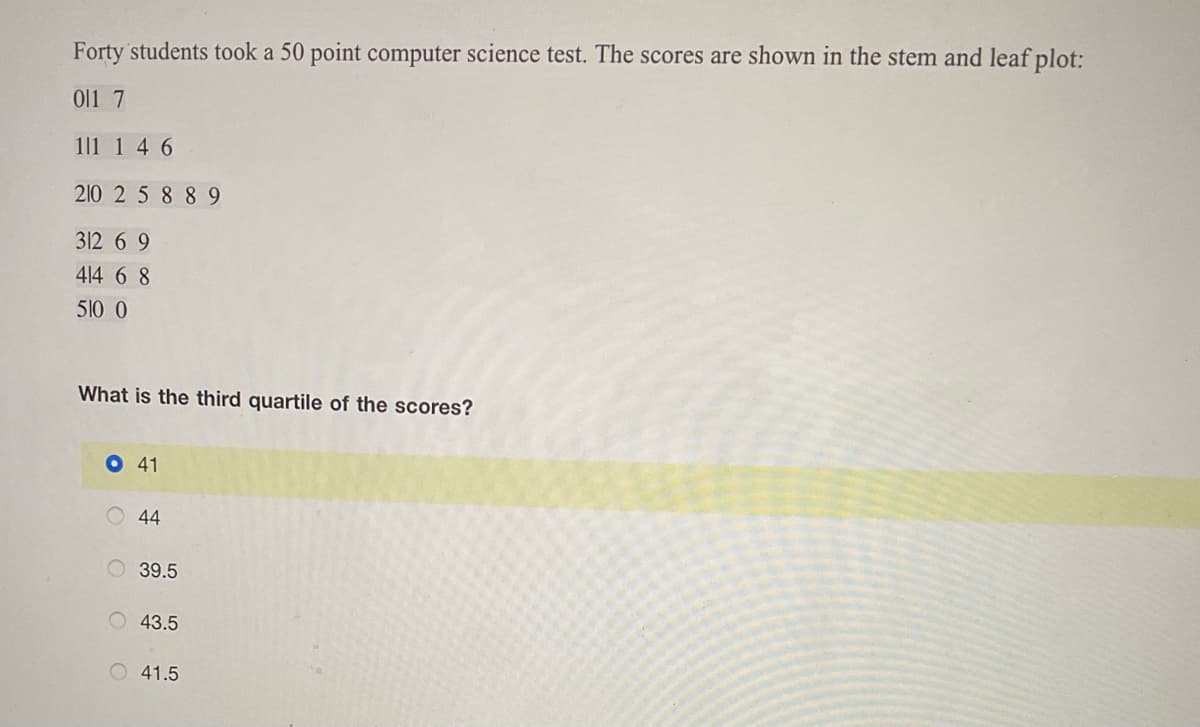
Transcribed Image Text:Forty students took a 50 point computer science test. The scores are shown in the stem and leaf plot:
0l1 7
1|1 1 4 6
210 2 5 8 8 9
312 6 9
414 6 8
510 0
What is the third quartile of the scores?
O41
O 44
O 39.5
43.5
O 41.5
Expert Solution
This question has been solved!
Explore an expertly crafted, step-by-step solution for a thorough understanding of key concepts.

Step by step
Solved in 2 steps

Recommended textbooks for you
Glencoe Algebra 1, Student Edition, 9780079039897…
Algebra
ISBN:
9780079039897
Author:
Carter
Publisher:
McGraw Hill
Glencoe Algebra 1, Student Edition, 9780079039897…
Algebra
ISBN:
9780079039897
Author:
Carter
Publisher:
McGraw Hill