In the dataset below 1.15 0.33 0.40 0.33 1.35 0.38 0.25 0.40 0.35 (a) Skewness in the stemplot of this data affects the appropriateness of procedures. using the t-distribution. Give two 95% confidence intervals, for the population mean, one with the outliers and one without, if any exist, using t-procedures. (b) How did the removal of outliers effect the confidence interval length, critical t- value and sample standard deviation?
In the dataset below 1.15 0.33 0.40 0.33 1.35 0.38 0.25 0.40 0.35 (a) Skewness in the stemplot of this data affects the appropriateness of procedures. using the t-distribution. Give two 95% confidence intervals, for the population mean, one with the outliers and one without, if any exist, using t-procedures. (b) How did the removal of outliers effect the confidence interval length, critical t- value and sample standard deviation?

Glencoe Algebra 1, Student Edition, 9780079039897, 0079039898, 2018
18th Edition
ISBN:9780079039897
Author:Carter
Publisher:Carter
Chapter10: Statistics
Section10.4: Distributions Of Data
Problem 19PFA

Related questions
Question
Transcribed Image Text:In the dataset below
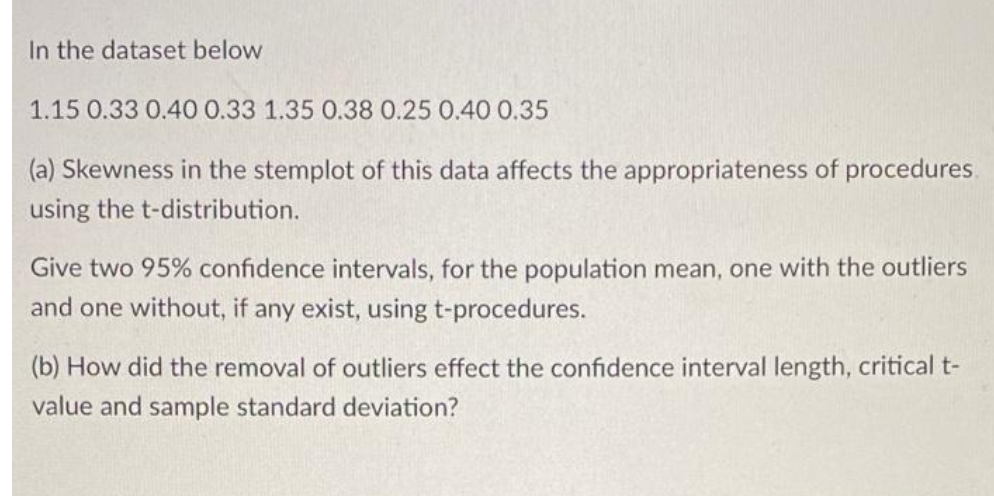
1.15 0.33 0.40 0.33 1.35 0.38 0.25 0.40 0.35
(a) Skewness in the stemplot of this data affects the appropriateness of procedures.
using the t-distribution.
Give two 95% confidence intervals, for the population mean, one with the outliers
and one without, if any exist, using t-procedures.
(b) How did the removal of outliers effect the confidence interval length, critical t-
value and sample standard deviation?
Expert Solution
This question has been solved!
Explore an expertly crafted, step-by-step solution for a thorough understanding of key concepts.

This is a popular solution!

Trending now
This is a popular solution!

Step by step
Solved in 2 steps with 2 images

Recommended textbooks for you
Glencoe Algebra 1, Student Edition, 9780079039897…
Algebra
ISBN:
9780079039897
Author:
Carter
Publisher:
McGraw Hill
Glencoe Algebra 1, Student Edition, 9780079039897…
Algebra
ISBN:
9780079039897
Author:
Carter
Publisher:
McGraw Hill