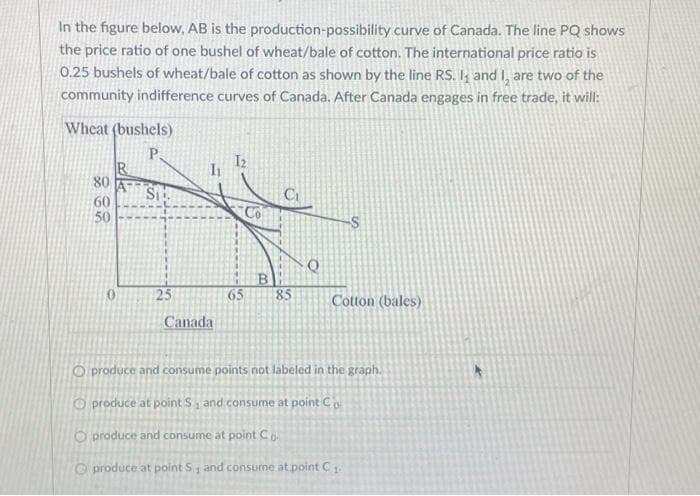
In the figure below, AB is the production-possibility curve of Canada. The line PQ shows the price ratio of one bushel of wheat/bale of cotton. The international price ratio is 0.25 bushels of wheat/bale of cotton as shown by the line RS. I, and I, are two of the community indifference curves of Canada. After Canada engages in free trade, it will: Wheat (bushels) P. 80 60 50 25 Canada 65 Co 85 Cotton (bales) O produce and consume points not labeled in the graph. produce at point S, and consume at point Co produce and consume at point Co produce at point S, and consume at point C₁
In the figure below, AB is the production-possibility curve of Canada. The line PQ shows the price ratio of one bushel of wheat/bale of cotton. The international price ratio is 0.25 bushels of wheat/bale of cotton as shown by the line RS. I, and I, are two of the community indifference curves of Canada. After Canada engages in free trade, it will: Wheat (bushels) P. 80 60 50 25 Canada 65 Co 85 Cotton (bales) O produce and consume points not labeled in the graph. produce at point S, and consume at point Co produce and consume at point Co produce at point S, and consume at point C₁
Principles of Economics 2e
2nd Edition
ISBN:9781947172364
Author:Steven A. Greenlaw; David Shapiro
Publisher:Steven A. Greenlaw; David Shapiro
Chapter33: International Trade
Section: Chapter Questions
Problem 2SCQ: Brazil can produce 100 pounds of beef or 10 autos. In contrast the United States can produce 40...
Related questions
Question
Typed plzzz And Asap
Thanks

Transcribed Image Text:In the figure below, AB is the production-possibility curve of Canada. The line PQ shows
the price ratio of one bushel of wheat/bale of cotton. The international price ratio is
0.25 bushels of wheat/bale of cotton as shown by the line RS. I, and I, are two of the
community indifference curves of Canada. After Canada engages in free trade, it will:
Wheat (bushels)
P.
80
60
50
Si
25
Canada
B
65 85
Q
Cotton (bales)
O produce and consume points not labeled in the graph.
produce at point S₁ and consume at point Co
produce and consume at point Co
produce at point S, and consume at point C₁
1
Expert Solution
This question has been solved!
Explore an expertly crafted, step-by-step solution for a thorough understanding of key concepts.
This is a popular solution!
Trending now
This is a popular solution!
Step by step
Solved in 3 steps

Knowledge Booster
Learn more about
Need a deep-dive on the concept behind this application? Look no further. Learn more about this topic, economics and related others by exploring similar questions and additional content below.Recommended textbooks for you

Principles of Economics 2e
Economics
ISBN:
9781947172364
Author:
Steven A. Greenlaw; David Shapiro
Publisher:
OpenStax


Principles of Economics 2e
Economics
ISBN:
9781947172364
Author:
Steven A. Greenlaw; David Shapiro
Publisher:
OpenStax


Economics (MindTap Course List)
Economics
ISBN:
9781337617383
Author:
Roger A. Arnold
Publisher:
Cengage Learning