in the first picture Consider the perfectly competitive market for copper. Assume that, regardless of how many firms are in the industry, every firm in the industry is identical and faces the marginal cost (MC), average total cost (ATC), and average variable cost (AVC) curves shown on the following graph. in the second picture, graph the supply curves when there are 20, 30, and 40 firms in the market If there were 20 firms in this market, the short-run equilibrium price of copper would be ________ per pound. At that price, firms in this industry would ____________ . Therefore, in the long run, firms would __________ the copper market. Because you know that perfectly competitive firms earn _____________ economic profit in the long run, you know the long-run equilibrium price must be ____________ per pound. From the graph, you can see that this means there will be ____________ firms operating in the copper industry in long-run equilibrium. True or False: Each of the firms operating in this industry in the long run earns negative accounting profit. True False
in the first picture Consider the perfectly competitive market for copper. Assume that, regardless of how many firms are in the industry, every firm in the industry is identical and faces the marginal cost (MC), average total cost (ATC), and average variable cost (AVC) curves shown on the following graph. in the second picture, graph the supply curves when there are 20, 30, and 40 firms in the market If there were 20 firms in this market, the short-run equilibrium price of copper would be ________ per pound. At that price, firms in this industry would ____________ . Therefore, in the long run, firms would __________ the copper market. Because you know that perfectly competitive firms earn _____________ economic profit in the long run, you know the long-run equilibrium price must be ____________ per pound. From the graph, you can see that this means there will be ____________ firms operating in the copper industry in long-run equilibrium. True or False: Each of the firms operating in this industry in the long run earns negative accounting profit. True False

Chapter1: Making Economics Decisions
Section: Chapter Questions
Problem 1QTC

Related questions
Question
in the first picture Consider the
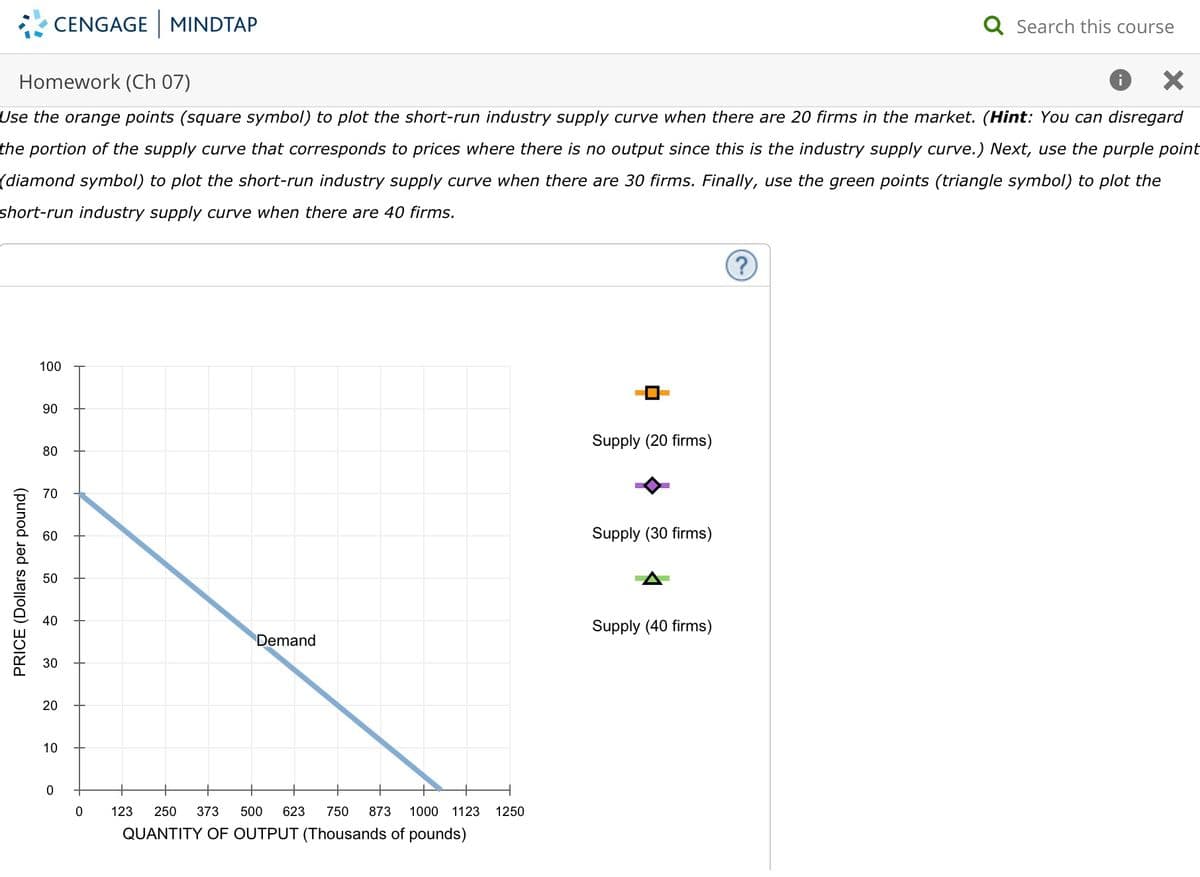
in the second picture, graph the supply curves when there are 20, 30, and 40 firms in the market
If there were 20 firms in this market, the short-run
per pound. At that price, firms in this industry would ____________ . Therefore, in the long run, firms would __________ the copper market.
Because you know that perfectly competitive firms earn _____________ economic profit in the long run, you know the long-run equilibrium price must be ____________
per pound. From the graph, you can see that this means there will be ____________ firms operating in the copper industry in long-run equilibrium.
True or False: Each of the firms operating in this industry in the long run earns negative accounting profit.
True
False
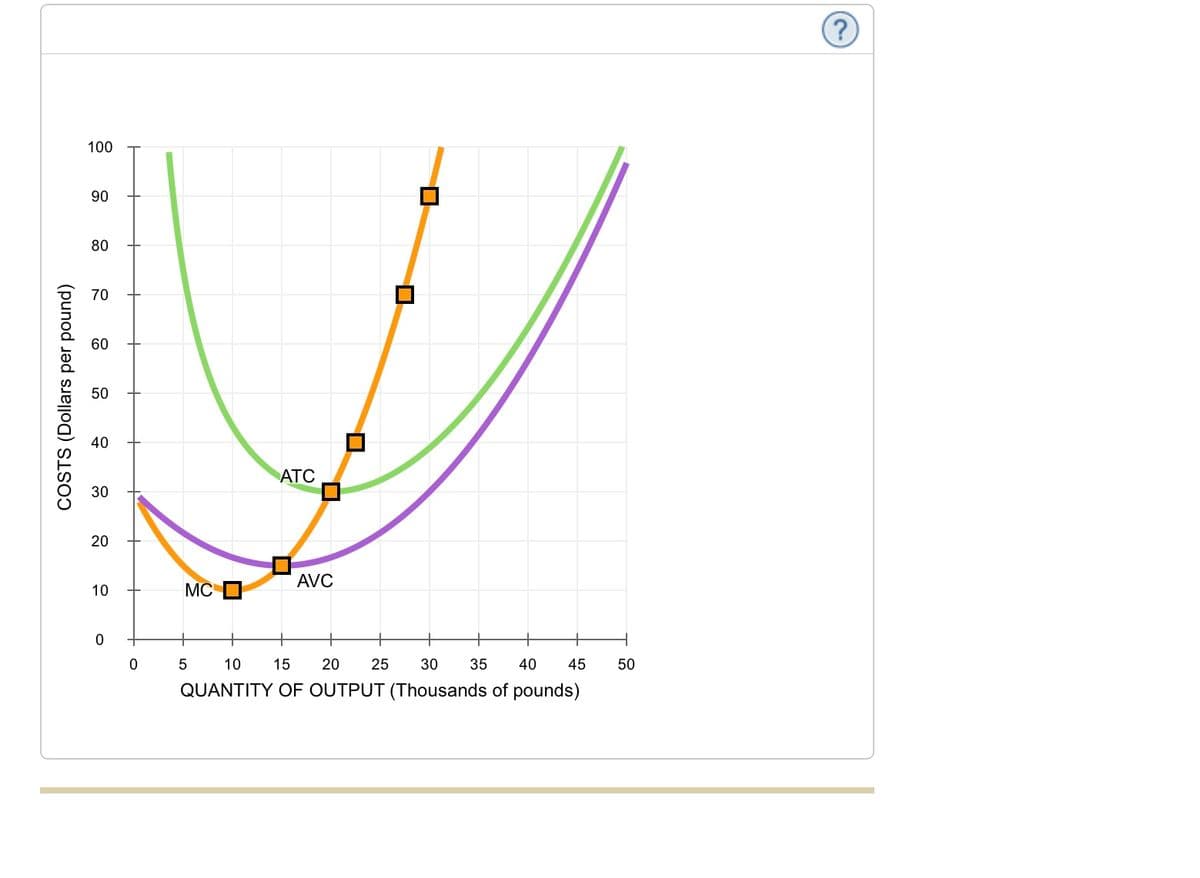
Transcribed Image Text:100
90
80
70
60
50
40
АТС
30
20
AVC
10
MC
5
10
15
20
25
30
35
40
45
50
QUANTITY OF OUTPUT (Thousands of pounds)
COSTS (Dollars per pound)
Transcribed Image Text:CENGAGE MINDTAP
Q Search this course
Homework (Ch 07)
Use the orange points (square symbol) to plot the short-run industry supply curve when there are 20 firms in the market. (Hint: You can disregard
the portion of the supply curve that corresponds to prices where there is no output since this is the industry supply curve.) Next, use the purple point
(diamond symbol) to plot the short-run industry supply curve when there are 30 firms. Finally, use the green points (triangle symbol) to plot the
short-run industry supply curve when there are 40 firms.
100
90
Supply (20 firms)
80
70
60
Supply (30 firms)
50
40
Supply (40 firms)
Demand
30
10
123
250
373
500
623
750
873
1000 1123 1250
QUANTITY OF OUTPUT (Thousands of pounds)
PRICE (Dollars per pound)
20
Expert Solution
This question has been solved!
Explore an expertly crafted, step-by-step solution for a thorough understanding of key concepts.

This is a popular solution!

Trending now
This is a popular solution!

Step by step
Solved in 4 steps with 2 images

Knowledge Booster


Learn more about
Need a deep-dive on the concept behind this application? Look no further. Learn more about this topic, economics and related others by exploring similar questions and additional content below.Recommended textbooks for you

Principles of Economics (12th Edition)
Economics
ISBN:
9780134078779
Author:
Karl E. Case, Ray C. Fair, Sharon E. Oster
Publisher:
PEARSON

Engineering Economy (17th Edition)
Economics
ISBN:
9780134870069
Author:
William G. Sullivan, Elin M. Wicks, C. Patrick Koelling
Publisher:
PEARSON
Principles of Economics (12th Edition)
Economics
ISBN:
9780134078779
Author:
Karl E. Case, Ray C. Fair, Sharon E. Oster
Publisher:
PEARSON
Engineering Economy (17th Edition)
Economics
ISBN:
9780134870069
Author:
William G. Sullivan, Elin M. Wicks, C. Patrick Koelling
Publisher:
PEARSON

Principles of Economics (MindTap Course List)
Economics
ISBN:
9781305585126
Author:
N. Gregory Mankiw
Publisher:
Cengage Learning

Managerial Economics: A Problem Solving Approach
Economics
ISBN:
9781337106665
Author:
Luke M. Froeb, Brian T. McCann, Michael R. Ward, Mike Shor
Publisher:
Cengage Learning

Managerial Economics & Business Strategy (Mcgraw-…
Economics
ISBN:
9781259290619
Author:
Michael Baye, Jeff Prince
Publisher:
McGraw-Hill Education