The graph to the right shows the aggregate demand curve, short-run aggregate supply curve, and the long-run potential output for an economy LRAS, 1.) Use the line drawing tool to show the short-run effect of monetary policy that causes an increase in interest rates. Properly label this line. SRAS, 2.) Use the point drawing tool to show the new equilibrium price level and real GDP in the short-run. Label this point 'B'. Carefully follow the instructions above, and only draw the required objects. AD1 Real GDP (Y) Price Level
The graph to the right shows the aggregate demand curve, short-run aggregate supply curve, and the long-run potential output for an economy LRAS, 1.) Use the line drawing tool to show the short-run effect of monetary policy that causes an increase in interest rates. Properly label this line. SRAS, 2.) Use the point drawing tool to show the new equilibrium price level and real GDP in the short-run. Label this point 'B'. Carefully follow the instructions above, and only draw the required objects. AD1 Real GDP (Y) Price Level

Principles of Macroeconomics (MindTap Course List)
8th Edition
ISBN:9781305971509
Author:N. Gregory Mankiw
Publisher:N. Gregory Mankiw
Chapter21: The Influence Of Monetary And Fiscal Policy On Aggregate Demand
Section: Chapter Questions
Problem 5CQQ

Related questions
Question
-Help plotting points and labeling
Need to be done in atleast 20 mins
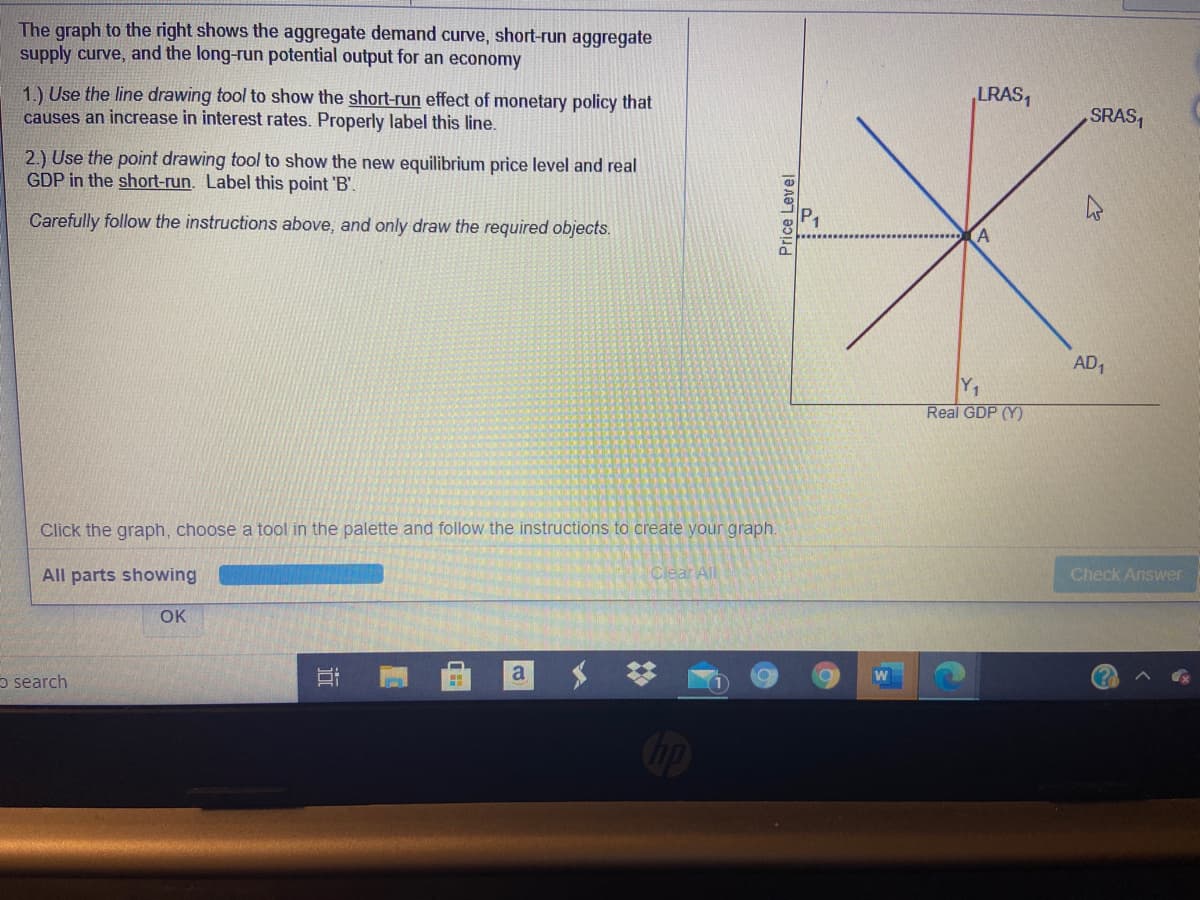
Transcribed Image Text:The graph to the right shows the aggregate demand curve, short-run aggregate
supply curve, and the long-run potential output for an economy
1.) Use the line drawing tool to show the short-run effect of monetary policy that
causes an increase in interest rates. Properly label this line.
LRAS,
SRAS,
2.) Use the point drawing tool to show the new equilibrium price level and real
GDP in the short-run. Label this point 'B'.
Carefully follow the instructions above, and only draw the required objects.
AD,
Y1
Real GDP (Y)
Click the graph, choose a tool in the palette and follow the instructions to create your graph.
All parts showing
Clear All
Check Answer
OK
a
o search
近
Price Level
Expert Solution
This question has been solved!
Explore an expertly crafted, step-by-step solution for a thorough understanding of key concepts.

This is a popular solution!

Trending now
This is a popular solution!

Step by step
Solved in 3 steps with 2 images

Knowledge Booster


Learn more about
Need a deep-dive on the concept behind this application? Look no further. Learn more about this topic, economics and related others by exploring similar questions and additional content below.Recommended textbooks for you
Principles of Macroeconomics (MindTap Course List)
Economics
ISBN:
9781305971509
Author:
N. Gregory Mankiw
Publisher:
Cengage Learning

Essentials of Economics (MindTap Course List)
Economics
ISBN:
9781337091992
Author:
N. Gregory Mankiw
Publisher:
Cengage Learning

Principles of Economics (MindTap Course List)
Economics
ISBN:
9781305585126
Author:
N. Gregory Mankiw
Publisher:
Cengage Learning
Principles of Macroeconomics (MindTap Course List)
Economics
ISBN:
9781305971509
Author:
N. Gregory Mankiw
Publisher:
Cengage Learning
Essentials of Economics (MindTap Course List)
Economics
ISBN:
9781337091992
Author:
N. Gregory Mankiw
Publisher:
Cengage Learning
Principles of Economics (MindTap Course List)
Economics
ISBN:
9781305585126
Author:
N. Gregory Mankiw
Publisher:
Cengage Learning

Brief Principles of Macroeconomics (MindTap Cours…
Economics
ISBN:
9781337091985
Author:
N. Gregory Mankiw
Publisher:
Cengage Learning

Principles of Economics, 7th Edition (MindTap Cou…
Economics
ISBN:
9781285165875
Author:
N. Gregory Mankiw
Publisher:
Cengage Learning

Principles of Macroeconomics (MindTap Course List)
Economics
ISBN:
9781285165912
Author:
N. Gregory Mankiw
Publisher:
Cengage Learning