In the following table, complete the marginal cost, average variable cost, and average total cost columns. Quantity Variable Cost Total Cost Marginal Cost Average Variable Cost Average Total Cost (Vats of juice) (Dollars) (Dollars) (Dollars) (Dollars) (Dollars) 30 1 10 40 25 55 45 75 4 70 100 100 130 6. 135 165
In the following table, complete the marginal cost, average variable cost, and average total cost columns. Quantity Variable Cost Total Cost Marginal Cost Average Variable Cost Average Total Cost (Vats of juice) (Dollars) (Dollars) (Dollars) (Dollars) (Dollars) 30 1 10 40 25 55 45 75 4 70 100 100 130 6. 135 165

Chapter6: Proudction Costs
Section: Chapter Questions
Problem 9SQP

Related questions
Question
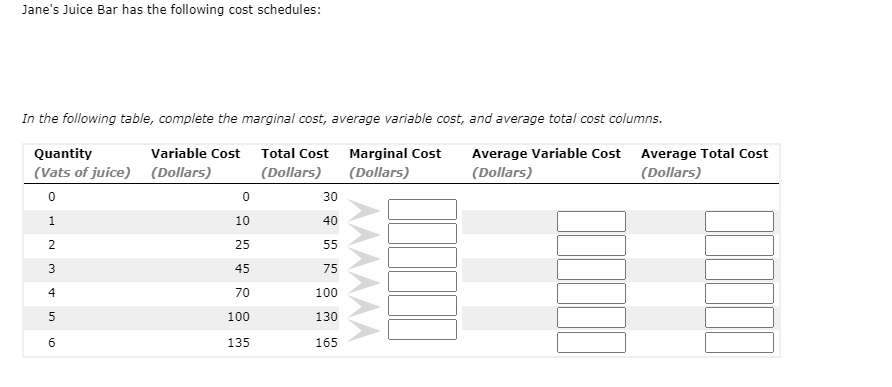
Transcribed Image Text:Jane's Juice Bar has the following cost schedules:
In the following table, complete the marginal cost, average variable cost, and average total cost columns.
Quantity
Variable Cost
Total Cost
Marginal Cost
Average Variable Cost Average Total Cost
(Vats of juice) (Dollars)
(Dollars)
(Dollars)
(Dollars)
(Dollars)
30
1
10
40
25
55
45
75
70
100
100
130
135
165
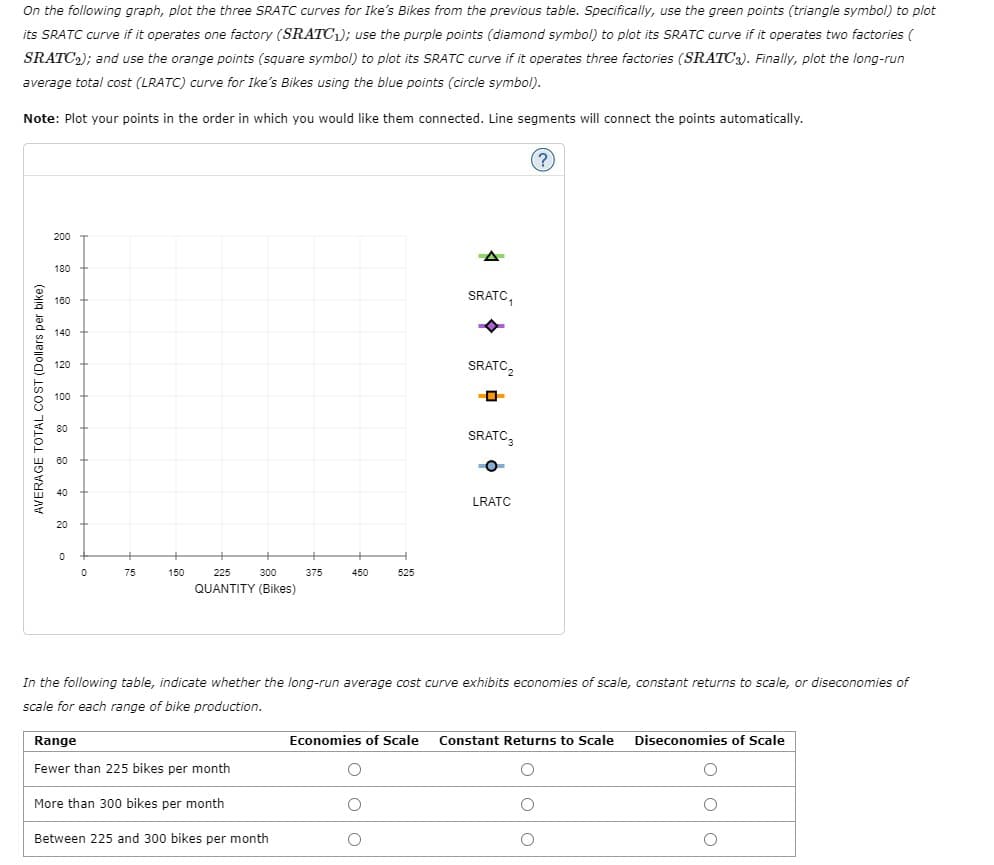
Transcribed Image Text:On the following graph, plot the three SRATC curves for Ike's Bikes from the previous table. Specifically, use the green points (triangle symbol) to plot
its SRATC curve if it operates one factory (SRATC1); use the purple points (diamond symbol) to plot its SRATC curve if it operates two factories (
SRATC2); and use the orange points (square symbol) to plot its SRATC curve if it operates three factories (SRATC3). Finally, plot the long-run
average total cost (LRATC) curve for Ike's Bikes using the blue points (circle symbol).
Note: Plot your points in the order in which you would like them connected. Line segments will connect the points automatically.
(?
200
180
SRATC,
180
140
SRATC,
120
100
80
SRATC,
60
40
LRATC
20
75
150
225
300
375
450
525
QUANTITY (Bikes)
In the following table, indicate whether the long-run average cost curve exhibits economies of scale, constant returns to scale, or diseconomies of
scale for each range of bike production.
Range
Economies of Scale
Constant Returns to Scale
Diseconomies of Scale
Fewer than 225 bikes per month
More than 300 bikes per month
Between 225 and 300 bikes per month
AVERAGE TOTAL COST (Dollars per bike)
O o o
Expert Solution
This question has been solved!
Explore an expertly crafted, step-by-step solution for a thorough understanding of key concepts.

This is a popular solution!

Trending now
This is a popular solution!

Step by step
Solved in 2 steps with 3 images

Knowledge Booster


Learn more about
Need a deep-dive on the concept behind this application? Look no further. Learn more about this topic, economics and related others by exploring similar questions and additional content below.Recommended textbooks for you


Managerial Economics: A Problem Solving Approach
Economics
ISBN:
9781337106665
Author:
Luke M. Froeb, Brian T. McCann, Michael R. Ward, Mike Shor
Publisher:
Cengage Learning
Managerial Economics: A Problem Solving Approach
Economics
ISBN:
9781337106665
Author:
Luke M. Froeb, Brian T. McCann, Michael R. Ward, Mike Shor
Publisher:
Cengage Learning


Essentials of Economics (MindTap Course List)
Economics
ISBN:
9781337091992
Author:
N. Gregory Mankiw
Publisher:
Cengage Learning
