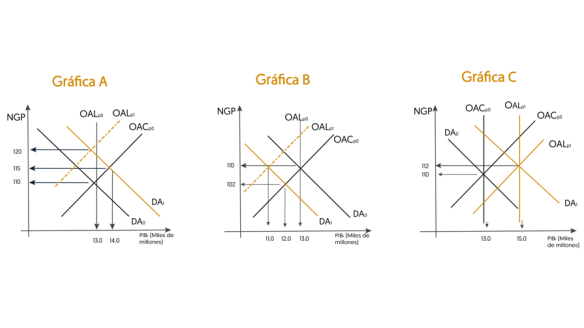
In the graph of Figure I, the annual growth rate of the GDP of the United States economy is presented since the first quarter of 2004, while, in the graphs of Figure II, three different scenarios of the relationship are represented between demand and aggregate supply that reflect different situations of economic growth. 2. Explain in detail what is happening in Graph A of Figure II and, after examining the data in the graph of Figure I, identify in what period of time this situation is occurring. Figure I = Real data of the United States economy Figure 2 = Representation of the aggregate demand and supply model DA = AGGREGATE DEMAND GDP = GROSS DOMESTIC PRODUCT NGP = GENERAL PRICE LEVEL OAL = LONG TERM AGGREGATE OFFER OAC = SHORT-TERM AGGREGATE OFFER Figure 1
In the graph of Figure I, the annual growth rate of the GDP of the United States economy is presented since the first quarter of 2004, while, in the graphs of Figure II, three different scenarios of the relationship are represented between
2. Explain in detail what is happening in Graph A of Figure II and, after examining the data in the graph of Figure I, identify in what period of time this situation is occurring.
Figure I = Real data of the United States economy
Figure 2 = Representation of the aggregate demand and supply model
DA = AGGREGATE DEMAND
GDP =
NGP = GENERAL PRICE LEVEL
OAL = LONG TERM AGGREGATE OFFER
OAC = SHORT-TERM AGGREGATE OFFER
Figure 1

![Annual Percentage Change in U.S. Real GDP
10
(Quarter-Annual)
8
6
-8
-10
Fuente: Table 1.1.1. Percent Change from Preceding Period in Real Gross Domestic Produc
[Percent] Seasonally adjusted at annual rates
Annual Percentage Change
Ql- 2004
QI- 2006
QI- 2008](/v2/_next/image?url=https%3A%2F%2Fcontent.bartleby.com%2Fqna-images%2Fquestion%2Fe589f950-7919-4956-b895-bffa31133c8b%2Fb678babf-4a21-45ab-aa60-fc9a6b33b2c7%2Foy6j67i_processed.png&w=3840&q=75)
Step by step
Solved in 4 steps


