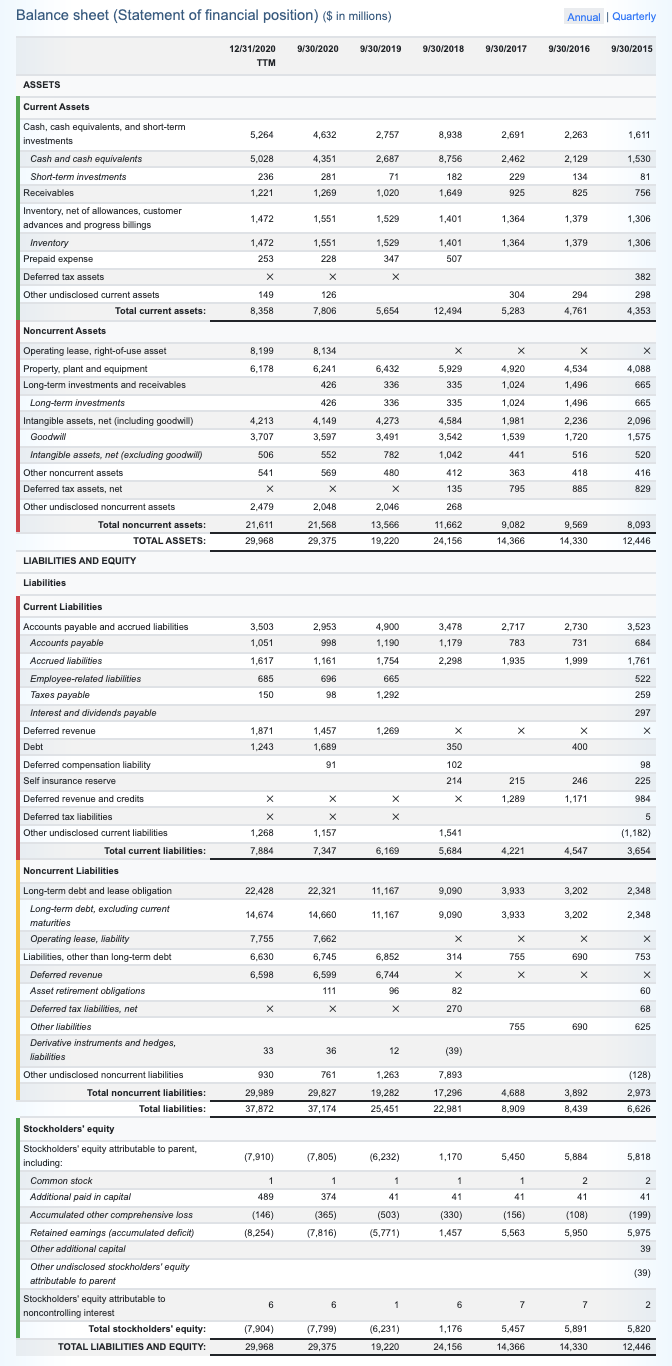
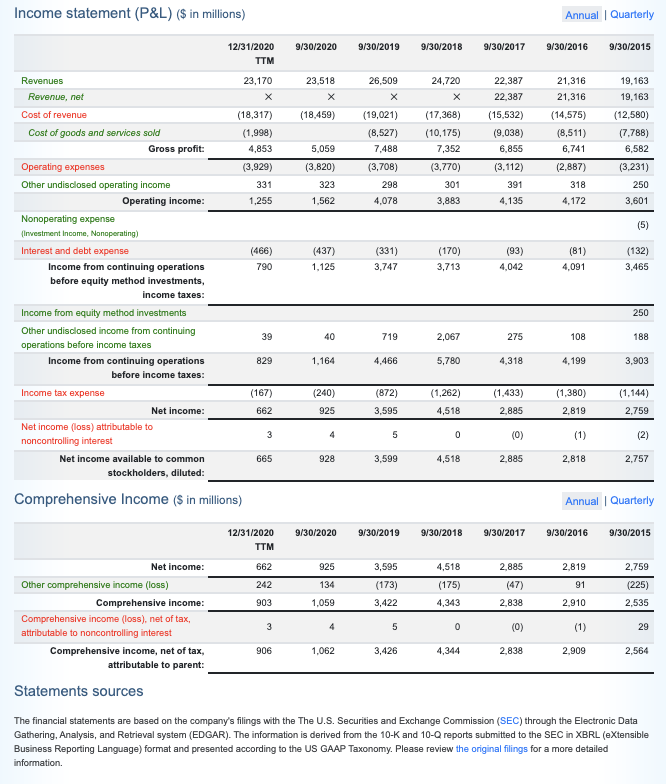
Analyze the financial statements of the company to you in terms of: 1. Solvency Ratio: *Equity Ratio 2. Asset Management Ratio: *Invetory Turnover Ratio *Fixed Asset Turnover Ratio *Total Asset Turnover Ratio 3. Debt Management Ratio: *Time Interest Earned Ratio
Analyze the financial statements of the company to you in terms of: 1. Solvency Ratio: *Equity Ratio 2. Asset Management Ratio: *Invetory Turnover Ratio *Fixed Asset Turnover Ratio *Total Asset Turnover Ratio 3. Debt Management Ratio: *Time Interest Earned Ratio
Analyze the financial statements of the company to you in terms of: 1. Solvency Ratio: *Equity Ratio 2. Asset Management Ratio: *Invetory Turnover Ratio *Fixed Asset Turnover Ratio *Total Asset Turnover Ratio 3. Debt Management Ratio: *Time Interest Earned Ratio
Transcribed Image Text:Income statement (P&L) ($ in millions)
Annual | Quarterly
12/31/2020
9/30/2020
9/30/2019
9/30/2018
9/30/2017
9/30/2016
9/30/2015
TTM
Revenues
23,170
23,518
26,509
24,720
22,387
21,316
19,163
Revenue, net
22,387
21,316
19,163
Cost of revenue
(18,317)
(18,459)
(19,021)
(17,368)
(15,532)
(14,575)
(12,580)
Cost of goods and services sold
(1,998)
(8,527)
(10,175)
(9,038)
(8,511)
(7,788)
Gross profit:
4,853
5,059
7,488
7,352
6,855
6,741
6,582
Operating expenses
(3,929)
(3,820)
(3,708)
(3,770)
(3,112)
(2,887)
(3,231)
Other undisclosed operating income
331
323
298
301
391
318
250
Operating income:
1,255
1,562
4,078
3,883
4,135
4,172
3,601
Nonoperating expense
(5)
(Investment Income, Nonoperating)
Interest and debt expense
(466)
(437)
(331)
(170)
(93)
(81)
(132)
Income from continuing operations
790
1,125
3,747
3,713
4,042
4,091
3,465
before equity method investments,
income taxes:
Income from equity method investments
250
Other undisclosed income from continuing
39
40
719
2,067
275
108
188
operations before income taxes
Income from continuing operations
829
1,164
4,466
5,780
4,318
4,199
3,903
before income taxes:
Income tax expense
(167)
(240)
(872)
(1,262)
(1,433)
(1,380)
(1,144)
Net income:
662
925
3,595
4,518
2,885
2,819
2,759
Net income (loss) attributable to
(0)
(1)
(2)
noncontrolling interest
Net income available to common
665
928
3,599
4,518
2,885
2,818
2,757
stockholders, diluted:
Comprehensive Income ($ in millions)
Annual | Quarterly
12/31/2020
9/30/2020
9/30/2019
9/30/2018
9/30/2017
9/30/2016
9/30/2015
TTM
Net income:
662
925
3,595
4,518
2,885
2,819
2,759
Other comprehensive income (loss)
242
134
(173)
(175)
(47)
91
(225)
Comprehensive income:
903
1,059
3,422
4,343
2,838
2,910
2,535
Comprehensive income (loss), net of tax,
(0)
(1)
29
attributable to noncontrolling interest
Comprehensive income, net of tax,
attributable to parent:
906
1,062
3,426
4,344
2,838
2,909
2,564
Statements sources
The financial statements are based on the company's filings with the The U.S. Securities and Exchange Commission (SEC) through the Electronic Data
Gathering, Analysis, and Retrieval system (EDGAR). The information is derived from the 10-K and 10-Q reports submitted to the SEC in XBRL (eXtensible
Business Reporting Language) format and presented according to the US GAAP Taxonomy. Please review the original filings for a more detailed
information.
Expert Solution
This question has been solved!
Explore an expertly crafted, step-by-step solution for a thorough understanding of key concepts.