In the US, 43.9% of all people have type O blood, 40.6% have type A blood, 10.8% have type B blood and 4.7% have type AB blood. A researcher wants to see if the distribution of blood type is different for millionaires. The table below shows the results of a random sample of 3488 millionaires. What can be concluded at the a = 0.05 significance level? a. Complete the table by filling in the expected frequencies. Round to the nearest whole number: Frequencies of Blood Type Outcome Frequency Expected Frequency 1521 A 1427 276
In the US, 43.9% of all people have type O blood, 40.6% have type A blood, 10.8% have type B blood and 4.7% have type AB blood. A researcher wants to see if the distribution of blood type is different for millionaires. The table below shows the results of a random sample of 3488 millionaires. What can be concluded at the a = 0.05 significance level? a. Complete the table by filling in the expected frequencies. Round to the nearest whole number: Frequencies of Blood Type Outcome Frequency Expected Frequency 1521 A 1427 276

Holt Mcdougal Larson Pre-algebra: Student Edition 2012
1st Edition
ISBN:9780547587776
Author:HOLT MCDOUGAL
Publisher:HOLT MCDOUGAL
Chapter11: Data Analysis And Probability
Section11.4: Collecting Data
Problem 3E

Related questions

Topic Video
Question
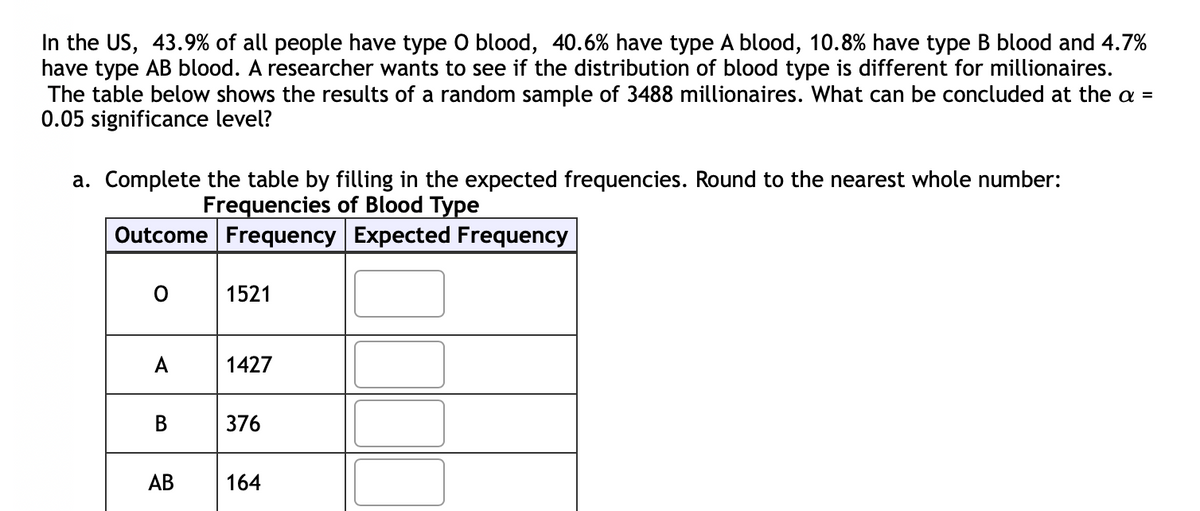
Transcribed Image Text:In the US, 43.9% of all people have type O blood, 40.6% have type A blood, 10.8% have type B blood and 4.7%
have type AB blood. A researcher wants to see if the distribution of blood type is different for millionaires.
The table below shows the results of a random sample of 3488 millionaires. What can be concluded at the a =
0.05 significance level?
a. Complete the table by filling in the expected frequencies. Round to the nearest whole number:
Frequencies of Blood Type
Outcome Frequency Expected Frequency
1521
A
1427
В
376
АВ
164
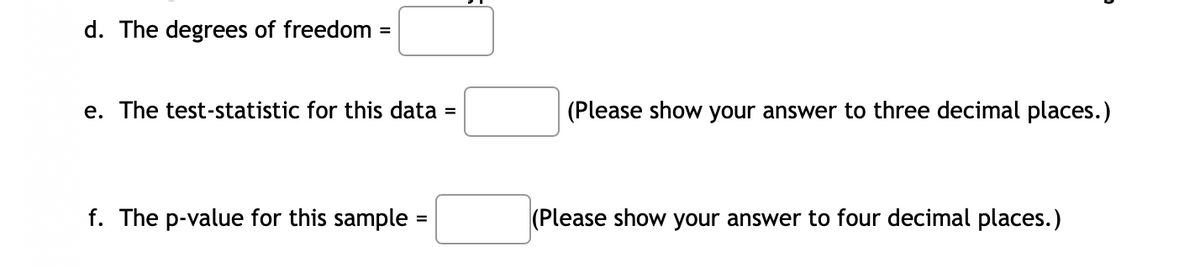
Transcribed Image Text:d. The degrees of freedom
%3D
e. The test-statistic for this data =
(Please show your answer to three decimal places.)
f. The p-value for this sample :
(Please show your answer to four decimal places.)
Expert Solution
This question has been solved!
Explore an expertly crafted, step-by-step solution for a thorough understanding of key concepts.

Step by step
Solved in 2 steps

Knowledge Booster


Learn more about
Need a deep-dive on the concept behind this application? Look no further. Learn more about this topic, statistics and related others by exploring similar questions and additional content below.Recommended textbooks for you
Holt Mcdougal Larson Pre-algebra: Student Edition…
Algebra
ISBN:
9780547587776
Author:
HOLT MCDOUGAL
Publisher:
HOLT MCDOUGAL

College Algebra (MindTap Course List)
Algebra
ISBN:
9781305652231
Author:
R. David Gustafson, Jeff Hughes
Publisher:
Cengage Learning

Glencoe Algebra 1, Student Edition, 9780079039897…
Algebra
ISBN:
9780079039897
Author:
Carter
Publisher:
McGraw Hill
Holt Mcdougal Larson Pre-algebra: Student Edition…
Algebra
ISBN:
9780547587776
Author:
HOLT MCDOUGAL
Publisher:
HOLT MCDOUGAL
College Algebra (MindTap Course List)
Algebra
ISBN:
9781305652231
Author:
R. David Gustafson, Jeff Hughes
Publisher:
Cengage Learning
Glencoe Algebra 1, Student Edition, 9780079039897…
Algebra
ISBN:
9780079039897
Author:
Carter
Publisher:
McGraw Hill
