In the US, 44.8% of all people have type O blood, 40.8% have type A blood, 11.3% have type B blood and 3.1% have type AB blood. Aresearcher wants to see if the distribution of blood type is different for millionalres. The table below shows the results of a random sample of 2972 millionaires. What can be concluded at the a = 0.10 significance level?
In the US, 44.8% of all people have type O blood, 40.8% have type A blood, 11.3% have type B blood and 3.1% have type AB blood. Aresearcher wants to see if the distribution of blood type is different for millionalres. The table below shows the results of a random sample of 2972 millionaires. What can be concluded at the a = 0.10 significance level?

Glencoe Algebra 1, Student Edition, 9780079039897, 0079039898, 2018
18th Edition
ISBN:9780079039897
Author:Carter
Publisher:Carter
Chapter10: Statistics
Section10.6: Summarizing Categorical Data
Problem 30PPS

Related questions
Topic Video
Question
Transcribed Image Text:H:
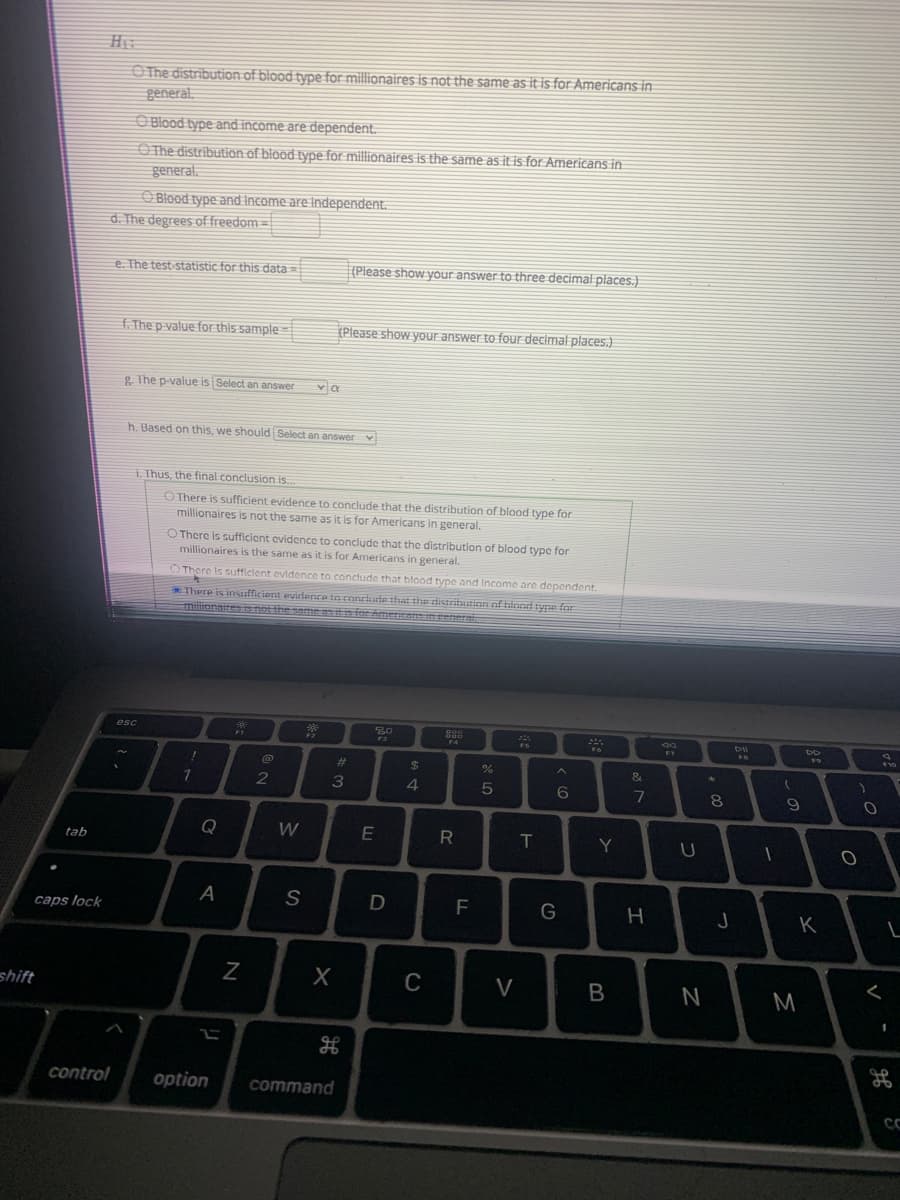
O The distribution of blood type for millionaires is not the same as it is for Americans in
general.
O Blood bype and income are dependent.
O The distribution of blood type for millionaires is the Same as it is for Americans in
general.
O Blood type and Income are Independent.
d. The degrees of freedom =
e. The test-statistic for this data =
{Please show your answer to three decimal places.)
f. The p-value for this sample=
(Please show your answer to four decimal places.).
g The p-value is Select an answer
h. Based on this, we should Select an answer v
1. Thus, the final conclusion is.
O There is sufficient evidence to conclude that the distribution of blood type for
millionaires is not the same as it is for Americans in general.
O There is sufficient evidence to conclude that the distribution of blood type for
millionaires is the same as it is for Americans in general.
O There is sufficient evidence to conctude that blood type and Income are dependent.
WThere is insufficiont evirtenca to conckrde that the distritustion of hiond tyne for
esc
30
888
DO
%23
24
2
6.
8
Q
W
tab
Y
caps lock
F
J
K
shift
C
V
N
M
control
option
command
エ
R
リ
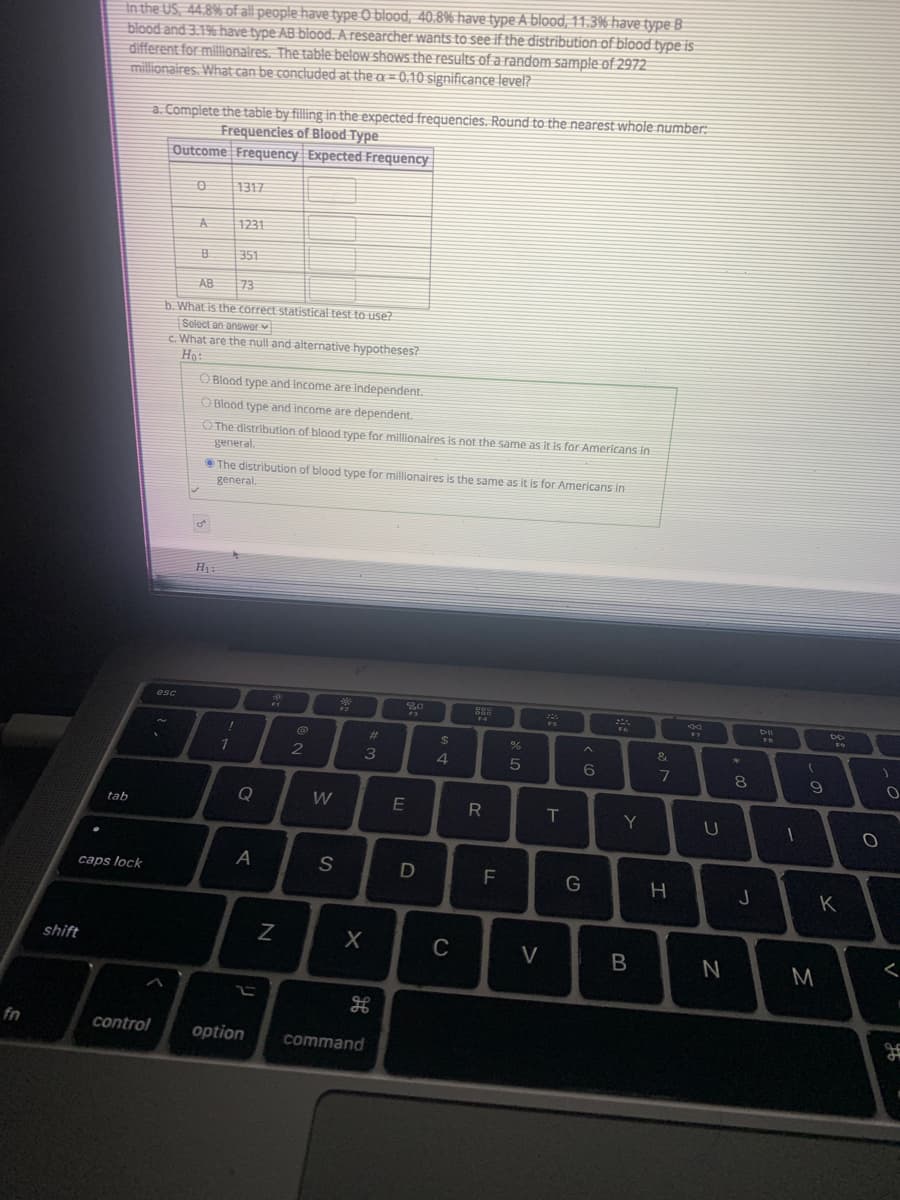
Transcribed Image Text:In the US, 44.8% of all people have type O blood, 40.8% have type A blood, 11.3% have type B
blood and 3.19% have type AB blood. Aresearcher wants to see if the distribution of blood type is
different for millonalres. The table below shows the results of a random sample of 2972
millionaires. What can be concluded at the a = 0.10 significance level?
a. Complete the table by filling in the expected frequencies. Round to the nearest whole number:
Frequencies of Blood Type
Outcome Frequency Expected Frequency
1317
A
1231
351
AB
73
b. What is the correct statisticat test to use?
Select an answor
c. What are the null and alternative hypotheses?
Ho:
O Blood type and income are independent.
O Blood type and income are dependent.
O The distribution of blood type for millionaires is not the same as it is for Americans in
general.
The distribution of blood type for millionaires is the same as it is for Americans in
general,
H1:
P3
%23
24
3
4
6
8.
Q
E
T
tab
Y
S
D
F
G
caps lock
K
shift
C
V
N
M
fn
control
option
command
LO
2
A
Expert Solution
This question has been solved!
Explore an expertly crafted, step-by-step solution for a thorough understanding of key concepts.

This is a popular solution!

Trending now
This is a popular solution!

Step by step
Solved in 2 steps

Knowledge Booster


Learn more about
Need a deep-dive on the concept behind this application? Look no further. Learn more about this topic, statistics and related others by exploring similar questions and additional content below.Recommended textbooks for you
Glencoe Algebra 1, Student Edition, 9780079039897…
Algebra
ISBN:
9780079039897
Author:
Carter
Publisher:
McGraw Hill

College Algebra (MindTap Course List)
Algebra
ISBN:
9781305652231
Author:
R. David Gustafson, Jeff Hughes
Publisher:
Cengage Learning

Holt Mcdougal Larson Pre-algebra: Student Edition…
Algebra
ISBN:
9780547587776
Author:
HOLT MCDOUGAL
Publisher:
HOLT MCDOUGAL
Glencoe Algebra 1, Student Edition, 9780079039897…
Algebra
ISBN:
9780079039897
Author:
Carter
Publisher:
McGraw Hill
College Algebra (MindTap Course List)
Algebra
ISBN:
9781305652231
Author:
R. David Gustafson, Jeff Hughes
Publisher:
Cengage Learning
Holt Mcdougal Larson Pre-algebra: Student Edition…
Algebra
ISBN:
9780547587776
Author:
HOLT MCDOUGAL
Publisher:
HOLT MCDOUGAL
