In the US, 45.1% of all people have type O blood, 39.6% have type A blood, 10.9% have type B blood and 4.4% have type AB blood. A researcher wants to see if the distribution of blood type is different for millionaires. The table below shows the results of a random sample of 614 millionaires. What can be concluded at the significant level of a = 0.05. For this study, we should use Chi-Square test for Goodness of Fit ✓ OP Your friend Caroline helped you with the null and alternative hypotheses... Ho: The distributions of blood types are the same between the general population and the millionaires. Ha: The distributions of blood types are NOT the same between the general population and the millionaires.
In the US, 45.1% of all people have type O blood, 39.6% have type A blood, 10.9% have type B blood and 4.4% have type AB blood. A researcher wants to see if the distribution of blood type is different for millionaires. The table below shows the results of a random sample of 614 millionaires. What can be concluded at the significant level of a = 0.05. For this study, we should use Chi-Square test for Goodness of Fit ✓ OP Your friend Caroline helped you with the null and alternative hypotheses... Ho: The distributions of blood types are the same between the general population and the millionaires. Ha: The distributions of blood types are NOT the same between the general population and the millionaires.

Holt Mcdougal Larson Pre-algebra: Student Edition 2012
1st Edition
ISBN:9780547587776
Author:HOLT MCDOUGAL
Publisher:HOLT MCDOUGAL
Chapter11: Data Analysis And Probability
Section: Chapter Questions
Problem 8CR

Related questions
Question
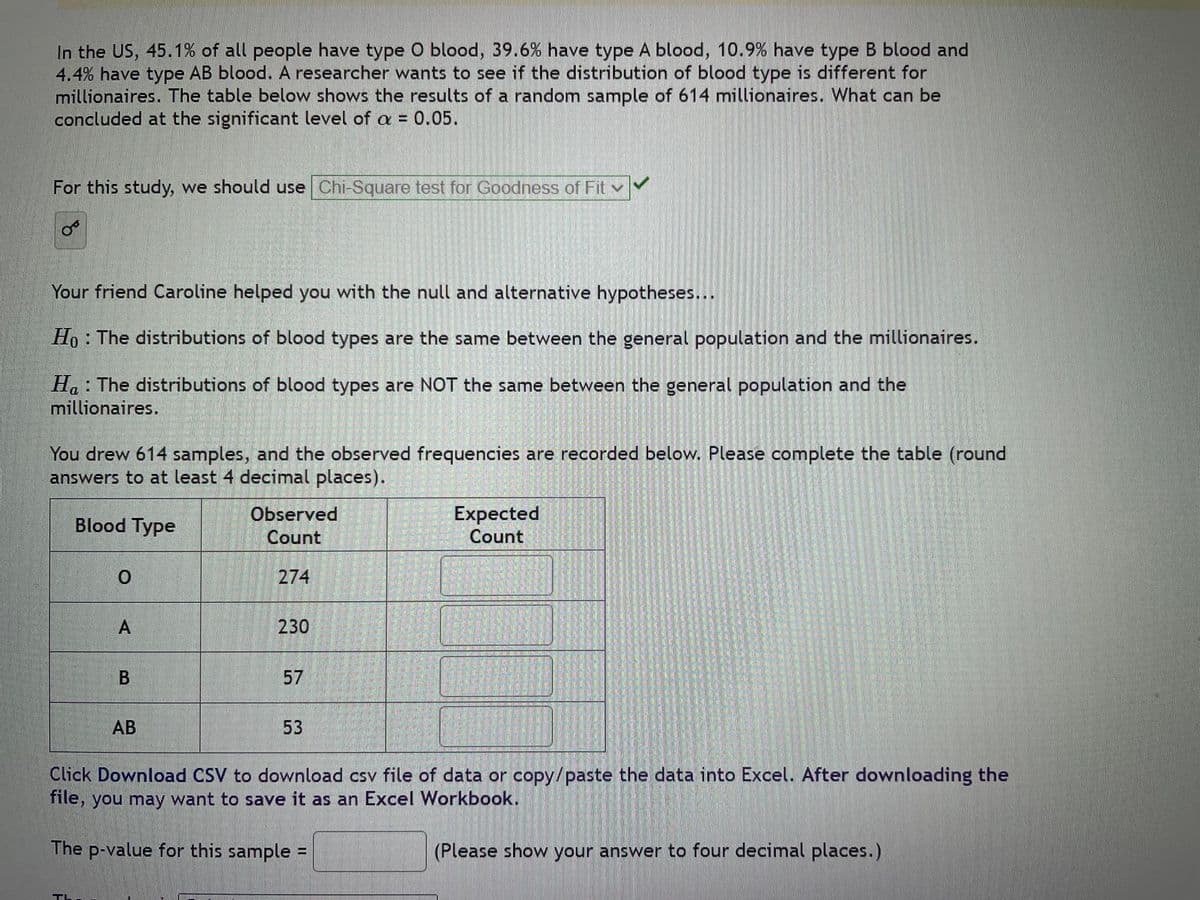
Transcribed Image Text:In the US, 45.1% of all people have type O blood, 39.6% have type A blood, 10.9% have type B blood and
4.4% have type AB blood. A researcher wants to see if the distribution of blood type is different for
millionaires. The table below shows the results of a random sample of 614 millionaires. What can be
concluded at the significant level of a = 0.05.
For this study, we should use Chi-Square test for Goodness of Fit
Your friend Caroline helped you with the null and alternative hypotheses...
Ho : The distributions of blood types are the same between the general population and the millionaires.
Ha: The distributions of blood types are NOT the same between the general population and the
millionaires.
You drew 614 samples, and the observed frequencies are recorded below. Please complete the table (round
answers to at least 4 decimal places).
Blood Type
0
A
B
AB
Observed
Count
274
230
57
53
Expected
Count
Click Download CSV to download csv file of data or copy/paste the data into Excel. After downloading the
file, you may want to save it as an Excel Workbook.
The p-value for this sample=
(Please show your answer to four decimal places.)
Expert Solution
This question has been solved!
Explore an expertly crafted, step-by-step solution for a thorough understanding of key concepts.

This is a popular solution!

Trending now
This is a popular solution!

Step by step
Solved in 3 steps with 1 images

Recommended textbooks for you
Holt Mcdougal Larson Pre-algebra: Student Edition…
Algebra
ISBN:
9780547587776
Author:
HOLT MCDOUGAL
Publisher:
HOLT MCDOUGAL

College Algebra (MindTap Course List)
Algebra
ISBN:
9781305652231
Author:
R. David Gustafson, Jeff Hughes
Publisher:
Cengage Learning

Glencoe Algebra 1, Student Edition, 9780079039897…
Algebra
ISBN:
9780079039897
Author:
Carter
Publisher:
McGraw Hill
Holt Mcdougal Larson Pre-algebra: Student Edition…
Algebra
ISBN:
9780547587776
Author:
HOLT MCDOUGAL
Publisher:
HOLT MCDOUGAL
College Algebra (MindTap Course List)
Algebra
ISBN:
9781305652231
Author:
R. David Gustafson, Jeff Hughes
Publisher:
Cengage Learning
Glencoe Algebra 1, Student Edition, 9780079039897…
Algebra
ISBN:
9780079039897
Author:
Carter
Publisher:
McGraw Hill