In this problem, assume that the distribution of differences is approximately normal. Note: For degrees of freedom d.f. not in the Student's t table, use the closest d.f. that is smaller. In some situations, this choice of d.f. may increase the P-value by a small amount and therefore produce a slightly more "conservative" answer. In an effort to determine if rats perform certain tasks more quickly if offered larger rewards, the following experiment was performed. On day 1, a group of four rats was given a reward of one food pellet each time they climbed a ladder. A second group of four rats was given a reward of five food pellets each time they climbed a ladder. On day 2, the groups were reversed, so the first group now got five food pellets for each climb and the second group got only one pellet for climbing the same ladder. The average times in seconds for each rat to climb the ladder 30 times are shown in the following table. Rat A B C D E F G H Time 1 pellet 12.1 13.7 11.4 12.1 11.0 10.4 14.6 12.3 Time 5 pellets 11.1 12.4 12.0 10.6 11.5 10.5 12.9 11.0 Do these data indicate that rats receiving larger rewards tend to climb the ladder in less time? Use a 5% level of significance. (Let d = Time 1 − Time 5.)


Inverse Normal Distribution
The method used for finding the corresponding z-critical value in a normal distribution using the known probability is said to be an inverse normal distribution. The inverse normal distribution is a continuous probability distribution with a family of two parameters.
Mean, Median, Mode
It is a descriptive summary of a data set. It can be defined by using some of the measures. The central tendencies do not provide information regarding individual data from the dataset. However, they give a summary of the data set. The central tendency or measure of central tendency is a central or typical value for a probability distribution.
Z-Scores
A z-score is a unit of measurement used in statistics to describe the position of a raw score in terms of its distance from the mean, measured with reference to standard deviation from the mean. Z-scores are useful in statistics because they allow comparison between two scores that belong to different normal distributions.
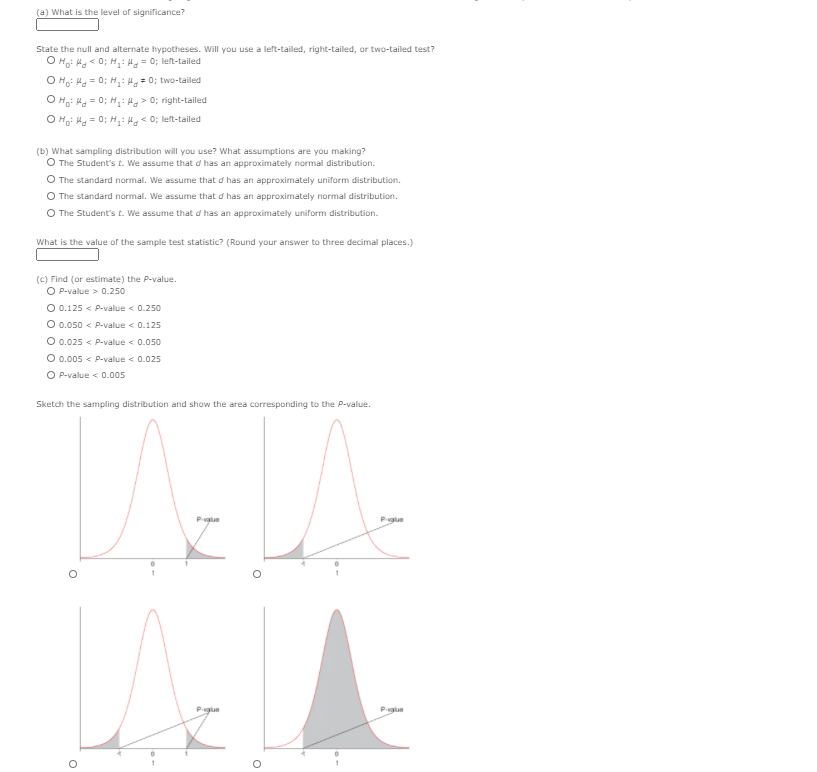
In this problem, assume that the distribution of differences is approximately normal. Note: For degrees of freedom d.f. not in the Student's t table, use the closest d.f. that is smaller. In some situations, this choice of d.f. may increase the P-value by a small amount and therefore produce a slightly more "conservative" answer.
In an effort to determine if rats perform certain tasks more quickly if offered larger rewards, the following experiment was performed. On day 1, a group of four rats was given a reward of one food pellet each time they climbed a ladder. A second group of four rats was given a reward of five food pellets each time they climbed a ladder. On day 2, the groups were reversed, so the first group now got five food pellets for each climb and the second group got only one pellet for climbing the same ladder. The average times in seconds for each rat to climb the ladder 30 times are shown in the following table.
| Rat | A | B | C | D | E | F | G | H |
| Time 1 pellet | 12.1 | 13.7 | 11.4 | 12.1 | 11.0 | 10.4 | 14.6 | 12.3 |
| Time 5 pellets | 11.1 | 12.4 | 12.0 | 10.6 | 11.5 | 10.5 | 12.9 | 11.0 |
Do these data indicate that rats receiving larger rewards tend to climb the ladder in less time? Use a 5% level of significance. (Let d = Time 1 − Time 5.)


Trending now
This is a popular solution!

Step by step
Solved in 3 steps with 1 images


