In this problem, we will simulate data collection from a soil temperature loT device by using two classess, SoilTempData and SoidTempIoT classes. The SoilTempData automatically collects soil temperature data every 100 ms. Also, it reports the statistics of the collected data every 1000 ms. The SoilTempData get the temperature from a soil temperature loT device, SoidTempIoT. ur job is to implement two classes, SoilTempData and SoidTempIoT 1.1. SoilTempIoT class randomly picks a temperature ranging from 10 to 60°C. This class has temp an instance variable to keep the latest temperature MIN_TEMP and MAx_TEMP are two constants that can be used as a possible range of the temperature. get Temp() method returns the latest temperature simulated as reading a temperature from the loT. Every time that there is a reading (calling get Temp()), before returning the current temperature, this method generates a new random temp (+ 10°C from the previous value) for the next round of reading. Note that when the temperature change + 10°C from the previous value makes sure that it is always in its possible range (10-60). einterface» ActionListener Java API Timer SoilTempData REPORT ROUND: int = 10 (readOnly) SoilTemploT -data: Integer(") (collection="ArrayList") -round: int -nextPrintindex: int +MIN TEMP: int = 10 (readOnly) -lot +MAX TEMP: Int = 60 (readonly -temp: int -rand: Random -time: Timer «Constructor»+SollTempData(iot: SolTemploT) +start(): void +actionPerformed(e: ActionEvent): void +printStat(): vold «constructor»+SoiITemploTO +getTemp(: int 1.2. SoilTempData class has variables: time is a javax.swing.Timer using for triggering the time event data is an ArrayList keeping the collection of temperature that were read so far. round is used for counting the round in order to print the graph. Thus, this value is used for comparing to the REPORT ROUND to check whether it is the round that needs to print the graph yet. nextPrintIndex keeps the starting position of the next print. REPORT ROUND is a constant (1000/100 = 10) to check whether it is the time to print the stat. methods: Constructor initializes proper values to data, round, nextPrintIndex, time and temp
In this problem, we will simulate data collection from a soil temperature loT device by using two classess, SoilTempData and SoidTempIoT classes. The SoilTempData automatically collects soil temperature data every 100 ms. Also, it reports the statistics of the collected data every 1000 ms. The SoilTempData get the temperature from a soil temperature loT device, SoidTempIoT. ur job is to implement two classes, SoilTempData and SoidTempIoT 1.1. SoilTempIoT class randomly picks a temperature ranging from 10 to 60°C. This class has temp an instance variable to keep the latest temperature MIN_TEMP and MAx_TEMP are two constants that can be used as a possible range of the temperature. get Temp() method returns the latest temperature simulated as reading a temperature from the loT. Every time that there is a reading (calling get Temp()), before returning the current temperature, this method generates a new random temp (+ 10°C from the previous value) for the next round of reading. Note that when the temperature change + 10°C from the previous value makes sure that it is always in its possible range (10-60). einterface» ActionListener Java API Timer SoilTempData REPORT ROUND: int = 10 (readOnly) SoilTemploT -data: Integer(") (collection="ArrayList") -round: int -nextPrintindex: int +MIN TEMP: int = 10 (readOnly) -lot +MAX TEMP: Int = 60 (readonly -temp: int -rand: Random -time: Timer «Constructor»+SollTempData(iot: SolTemploT) +start(): void +actionPerformed(e: ActionEvent): void +printStat(): vold «constructor»+SoiITemploTO +getTemp(: int 1.2. SoilTempData class has variables: time is a javax.swing.Timer using for triggering the time event data is an ArrayList keeping the collection of temperature that were read so far. round is used for counting the round in order to print the graph. Thus, this value is used for comparing to the REPORT ROUND to check whether it is the round that needs to print the graph yet. nextPrintIndex keeps the starting position of the next print. REPORT ROUND is a constant (1000/100 = 10) to check whether it is the time to print the stat. methods: Constructor initializes proper values to data, round, nextPrintIndex, time and temp

Database System Concepts
7th Edition
ISBN:9780078022159
Author:Abraham Silberschatz Professor, Henry F. Korth, S. Sudarshan
Publisher:Abraham Silberschatz Professor, Henry F. Korth, S. Sudarshan
Chapter1: Introduction
Section: Chapter Questions
Problem 1PE

Related questions
Question
Read all the information in the picture, and I gave
- follow the class diagram
- Coding SoilTempData.java following the class diagram
- Coding SoilTempIoT.java following the class diagram
- Use SoilTempDataTest.java as a test
- Make the output like the result
and don't forget a popup message
![printstatistic uses for printing the new set of data in that round and the statistics of the whole
data (all data in the data set). (See the example in the sample result).
Note: The standard deviation is caleulated by using this formula: sd =
start uses for making the Timer time to start
Test Program
public class SollTempDataTest {
public static void main(String[] args) {
SoilTempoata sensor - new SoilTempbata(new SoflTempIoT());
sensor.printstat();
sensor.start();
J0ptionPane. showtessageDialog(null, "Quit?");
Systen.exit(0);
Sample Result
********** Report Current Data: ****..
New set of data:
Statistics:
No data to report!
. Report Current Data: **.. ..
New set of data: 40, 39, 46, 54, 54, 60, 6e, 6e, 6e, 52,
Statistic:
Min - 39.00
Max - 60.e0
Average- 52.50
SD - 0.16
Report Current Data: *
New set of data: 48, 40, 37, 37, 46, 49, S4, 45, 45, 45,
Statistics:
Min - 37.00
Max - 6e.00
Average 48.55
SD- 0.79
*..... Report Current Data: .........
New set of data: 39, 43, 39, 39, 39, 39, 35, 36, 38, 47,
Statistics:
Min - 35.00
Max= 60.0ee
Average - 45.50
SD - 0.27
........* Report Current Data: ** .
New set of data: 52, 45, 42, 35, 40, 31, 39, 34, 25, 16,
Statistics:
Min - 16.e0
Max - 6e.ee
Average - 43.10
SD - 4.28
....... Report Current Data: ........
New set of data: 15, 20, 17, 11, 20, 21, 20, 12, 18, 17,
Statistics:
Min - 10.00
Max - 60.ee
Average- 37.74
SD - 2.93
******** Report Current Data: ***
New set of data: 15, 14, 16, 16, 17, 10, 14, 18, 13, 21,
Statistics:
Min - 10.0e
Max= 6e.ee
Average = 33.88
SO = 1.66
(continue to print until pressing OK button)](/v2/_next/image?url=https%3A%2F%2Fcontent.bartleby.com%2Fqna-images%2Fquestion%2F89aecf9c-8a80-4efb-a81e-9de5adc2d8d9%2F2c7edbd0-89f2-4afe-949d-b1830a232a5d%2F9j221so_processed.jpeg&w=3840&q=75)
Transcribed Image Text:printstatistic uses for printing the new set of data in that round and the statistics of the whole
data (all data in the data set). (See the example in the sample result).
Note: The standard deviation is caleulated by using this formula: sd =
start uses for making the Timer time to start
Test Program
public class SollTempDataTest {
public static void main(String[] args) {
SoilTempoata sensor - new SoilTempbata(new SoflTempIoT());
sensor.printstat();
sensor.start();
J0ptionPane. showtessageDialog(null, "Quit?");
Systen.exit(0);
Sample Result
********** Report Current Data: ****..
New set of data:
Statistics:
No data to report!
. Report Current Data: **.. ..
New set of data: 40, 39, 46, 54, 54, 60, 6e, 6e, 6e, 52,
Statistic:
Min - 39.00
Max - 60.e0
Average- 52.50
SD - 0.16
Report Current Data: *
New set of data: 48, 40, 37, 37, 46, 49, S4, 45, 45, 45,
Statistics:
Min - 37.00
Max - 6e.00
Average 48.55
SD- 0.79
*..... Report Current Data: .........
New set of data: 39, 43, 39, 39, 39, 39, 35, 36, 38, 47,
Statistics:
Min - 35.00
Max= 60.0ee
Average - 45.50
SD - 0.27
........* Report Current Data: ** .
New set of data: 52, 45, 42, 35, 40, 31, 39, 34, 25, 16,
Statistics:
Min - 16.e0
Max - 6e.ee
Average - 43.10
SD - 4.28
....... Report Current Data: ........
New set of data: 15, 20, 17, 11, 20, 21, 20, 12, 18, 17,
Statistics:
Min - 10.00
Max - 60.ee
Average- 37.74
SD - 2.93
******** Report Current Data: ***
New set of data: 15, 14, 16, 16, 17, 10, 14, 18, 13, 21,
Statistics:
Min - 10.0e
Max= 6e.ee
Average = 33.88
SO = 1.66
(continue to print until pressing OK button)
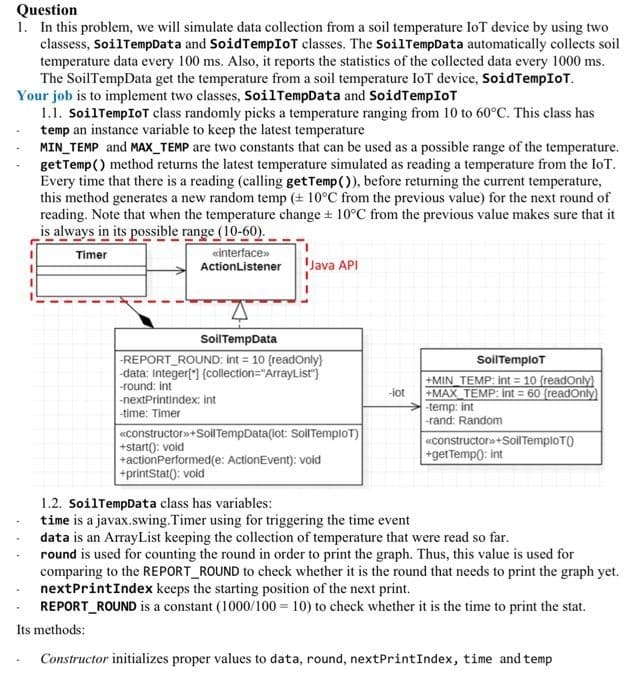
Transcribed Image Text:Question
1. In this problem, we will simulate data collection from a soil temperature loT device by using two
classess, SoilTempData and SoidTempIoT classes. The SoilTempData automatically collects soil
temperature data every 100 ms. Also, it reports the statistics of the collected data every 1000 ms.
The SoilTempData get the temperature from a soil temperature loT device, SoidTempIoT.
Your job is to implement two classes, SoilTempData and SoidTempIoT
1.1. SoilTempIoT class randomly picks a temperature ranging from 10 to 60°C. This class has
temp an instance variable to keep the latest temperature
MIN_TEMP and MAXX_TEMP are two constants that can be used as a possible range of the temperature.
getTemp() method returns the latest temperature simulated as reading a temperature from the loT.
Every time that there is a reading (calling getTemp(), before returning the current temperature,
this method generates a new random temp (+ 10°C from the previous value) for the next round of
reading. Note that when the temperature change + 10°C from the previous value makes sure that it
_is always in its possible range (10-60).
Timer
einterface»
ActionListener
Java API
SoilTempData
-REPORT_ROUND: int = 10 (readOnly}
-data: Integer(") (collection="ArrayList")
-round: int
-nextPrintindex: int
SoilTemploT
+MIN_TEMP: int = 10 (readOnly)
+MAX_TEMP: int = 60 (readOnly)
-temp: int
-rand: Random
-lot
-time: Timer
«Constructor»+SollTempData(iot: SoilTemploT)
+start(): void
+actionPerformed(e: ActionEvent): void
+printStat(): void
«Constructor»+SollTemploT)
+getTemp0: int
1.2. SoilTempData class has variables:
time is a javax.swing.Timer using for triggering the time event
data is an ArrayList keeping the collection of temperature that were read so far.
round is used for counting the round in order to print the graph. Thus, this value is used for
comparing to the REPORT_ROUND to check whether it is the round that needs to print the graph yet.
nextPrintIndex keeps the starting position of the next print.
REPORT_ROUND is a constant (1000/100 = 10) to check whether it is the time to print the stat.
Its methods:
Constructor initializes proper values to data, round, nextPrintIndex, time and temp
Expert Solution
This question has been solved!
Explore an expertly crafted, step-by-step solution for a thorough understanding of key concepts.

This is a popular solution!

Trending now
This is a popular solution!

Step by step
Solved in 3 steps with 5 images

Knowledge Booster


Learn more about
Need a deep-dive on the concept behind this application? Look no further. Learn more about this topic, computer-science and related others by exploring similar questions and additional content below.Recommended textbooks for you
Database System Concepts
Computer Science
ISBN:
9780078022159
Author:
Abraham Silberschatz Professor, Henry F. Korth, S. Sudarshan
Publisher:
McGraw-Hill Education

Starting Out with Python (4th Edition)
Computer Science
ISBN:
9780134444321
Author:
Tony Gaddis
Publisher:
PEARSON

Digital Fundamentals (11th Edition)
Computer Science
ISBN:
9780132737968
Author:
Thomas L. Floyd
Publisher:
PEARSON
Database System Concepts
Computer Science
ISBN:
9780078022159
Author:
Abraham Silberschatz Professor, Henry F. Korth, S. Sudarshan
Publisher:
McGraw-Hill Education
Starting Out with Python (4th Edition)
Computer Science
ISBN:
9780134444321
Author:
Tony Gaddis
Publisher:
PEARSON
Digital Fundamentals (11th Edition)
Computer Science
ISBN:
9780132737968
Author:
Thomas L. Floyd
Publisher:
PEARSON

C How to Program (8th Edition)
Computer Science
ISBN:
9780133976892
Author:
Paul J. Deitel, Harvey Deitel
Publisher:
PEARSON

Database Systems: Design, Implementation, & Manag…
Computer Science
ISBN:
9781337627900
Author:
Carlos Coronel, Steven Morris
Publisher:
Cengage Learning

Programmable Logic Controllers
Computer Science
ISBN:
9780073373843
Author:
Frank D. Petruzella
Publisher:
McGraw-Hill Education