In which year was water the most expensive in real terms? Show work. What was the real wage for Jakku’s minimum wage of $8.25 in 2014? Evaluate Jakku’s economic health. You must cite results from your previous calculations. Consider the market for loanable funds and assume that market is in equilibrium. Suppose that the overall income levels increase. Describe the initial effect, how the market adjusts, and how equilibrium is affected.
In which year was water the most expensive in real terms? Show work. What was the real wage for Jakku’s minimum wage of $8.25 in 2014? Evaluate Jakku’s economic health. You must cite results from your previous calculations. Consider the market for loanable funds and assume that market is in equilibrium. Suppose that the overall income levels increase. Describe the initial effect, how the market adjusts, and how equilibrium is affected.

Chapter6: Demand Relationships Among Goods
Section: Chapter Questions
Problem 6.3P

Related questions
Question
- In which year was water the most expensive in real terms? Show work.
- What was the real wage for Jakku’s minimum wage of $8.25 in 2014?
- Evaluate Jakku’s economic health. You must cite results from your previous calculations.
- Consider the market for loanable funds and assume that market is in equilibrium. Suppose that the overall income levels increase. Describe the initial effect, how the market adjusts, and how equilibrium is affected.
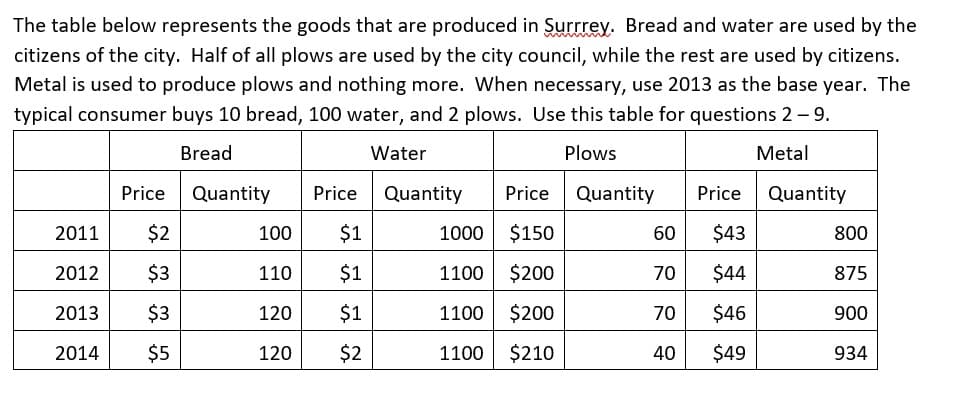
Transcribed Image Text:The table below represents the goods that are produced in Surrrey. Bread and water are used by the
citizens of the city. Half of all plows are used by the city council, while the rest are used by citizens.
Metal is used to produce plows and nothing more. When necessary, use 2013 as the base year. The
typical consumer buys 10 bread, 100 water, and 2 plows. Use this table for questions 2 – 9.
Bread
Water
Plows
Metal
Price
Quantity
Price
Quantity
Price
Quantity
Price
Quantity
2011
$2
100
$1
1000
$150
60
$43
800
2012
$3
110
$1
1100
$200
70
$44
875
2013
$3
120
$1
1100
$200
70
$46
900
2014
$5
120
$2
1100
$210
40
$49
934
Expert Solution
This question has been solved!
Explore an expertly crafted, step-by-step solution for a thorough understanding of key concepts.

This is a popular solution!

Trending now
This is a popular solution!

Step by step
Solved in 7 steps

Recommended textbooks for you

Exploring Economics
Economics
ISBN:
9781544336329
Author:
Robert L. Sexton
Publisher:
SAGE Publications, Inc

Exploring Economics
Economics
ISBN:
9781544336329
Author:
Robert L. Sexton
Publisher:
SAGE Publications, Inc


Economics Today and Tomorrow, Student Edition
Economics
ISBN:
9780078747663
Author:
McGraw-Hill
Publisher:
Glencoe/McGraw-Hill School Pub Co