Income ($ billions) 10 939 Disposable income is the amount left after taxes have been paid and is one measure of health of the economy. The table gives the total disposable income for a country, in billions of dollars, for selected years from 2010 and projected to 2040. Year 2010 2015 11521 2020 12.365 2025 14.124 Complete parts (a) through (c) below. 2030 15.811 2035 17.117 2040 19.522 a. Can this data be fitted exactly by a linear model? O A. Yes. The first differences are constant for uniform inputs. O B. Yes. Each first difference is double the previous first difference for uniform inputs. de O C. No. The data do not include every year between 2010 and 2040. nts O D. No. The first differences are not constant for uniform inputs. Less Click to select your answer and then click Check Answer. ccess a Library parts remainina
Income ($ billions) 10 939 Disposable income is the amount left after taxes have been paid and is one measure of health of the economy. The table gives the total disposable income for a country, in billions of dollars, for selected years from 2010 and projected to 2040. Year 2010 2015 11521 2020 12.365 2025 14.124 Complete parts (a) through (c) below. 2030 15.811 2035 17.117 2040 19.522 a. Can this data be fitted exactly by a linear model? O A. Yes. The first differences are constant for uniform inputs. O B. Yes. Each first difference is double the previous first difference for uniform inputs. de O C. No. The data do not include every year between 2010 and 2040. nts O D. No. The first differences are not constant for uniform inputs. Less Click to select your answer and then click Check Answer. ccess a Library parts remainina

Elementary Linear Algebra (MindTap Course List)
8th Edition
ISBN:9781305658004
Author:Ron Larson
Publisher:Ron Larson
Chapter2: Matrices
Section2.5: Markov Chain
Problem 45E: Epidemic Model In a population of 200,000 people, 40,000 are infected with a virus. After a person...

Related questions
Topic Video
Question

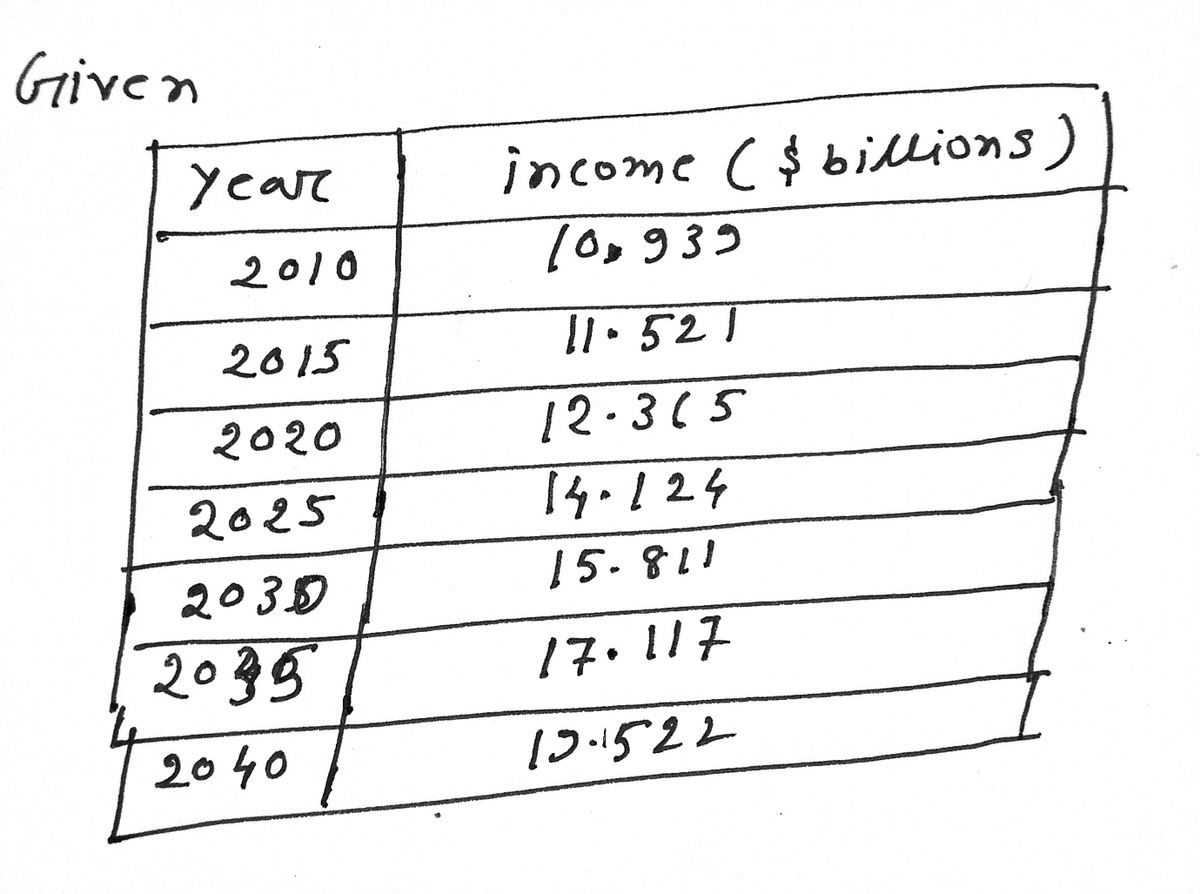
Transcribed Image Text:Income ($ billions)
Disposable income is the amount left after taxes have been
paid and is one measure of health of the economy. The table
gives the total disposable income for a country, in billions of
dollars, for selected years from 2010 and projected to 2040.
Year
2010
10.939
2015
11.521
2020
12.365
2025
14.124
Complete parts (a) through (c) below.
2030
15.811
2035
17.117
2040
19.522
a. Can this data be fitted exactly by a linear model?
O A. Yes. The first differences are constant for uniform inputs.
O B. Yes. Each first difference is double the previous first difference for uniform inputs.
de
O C. No. The data do not include every year between 2010 and 2040.
nts
O D. No. The first differences are not constant for uniform inputs.
tess
Click to select your answer and then click Check Answer.
ccess
2 parts
remaining
a Library
ClearAN
e Options
OK
Type here to search
Bb
F2
F3
F4
F5
F6
F8
F9
F10
F1
%23
&
3
7
R
T.
Y
S.
F
K
V
Retry
OK
44
D
Expert Solution
Step 1

Trending now
This is a popular solution!

Step by step
Solved in 2 steps with 2 images

Knowledge Booster


Learn more about
Need a deep-dive on the concept behind this application? Look no further. Learn more about this topic, algebra and related others by exploring similar questions and additional content below.Recommended textbooks for you
Elementary Linear Algebra (MindTap Course List)
Algebra
ISBN:
9781305658004
Author:
Ron Larson
Publisher:
Cengage Learning

Linear Algebra: A Modern Introduction
Algebra
ISBN:
9781285463247
Author:
David Poole
Publisher:
Cengage Learning
Elementary Linear Algebra (MindTap Course List)
Algebra
ISBN:
9781305658004
Author:
Ron Larson
Publisher:
Cengage Learning
Linear Algebra: A Modern Introduction
Algebra
ISBN:
9781285463247
Author:
David Poole
Publisher:
Cengage Learning