Independent of any possible effects of parasites, estimate the reduction in frog density caused by the addition of trouts. 180.2 - 111.4 = 68.8 frog per 10 meter² of pond surface area 180.2 - 125.8= 54.4 frog per 10 meter² of pond surface area 180.2 - 14.3 = 165.9 frog per 10 meter² of pond surface area (180.2 + 125.8)/2-(111.4 +14.3)/2 = 27.3 frog per 10 meter² of pond surface area
Independent of any possible effects of parasites, estimate the reduction in frog density caused by the addition of trouts. 180.2 - 111.4 = 68.8 frog per 10 meter² of pond surface area 180.2 - 125.8= 54.4 frog per 10 meter² of pond surface area 180.2 - 14.3 = 165.9 frog per 10 meter² of pond surface area (180.2 + 125.8)/2-(111.4 +14.3)/2 = 27.3 frog per 10 meter² of pond surface area

Biology (MindTap Course List)
11th Edition
ISBN:9781337392938
Author:Eldra Solomon, Charles Martin, Diana W. Martin, Linda R. Berg
Publisher:Eldra Solomon, Charles Martin, Diana W. Martin, Linda R. Berg
Chapter54: Community Ecology
Section: Chapter Questions
Problem 17TYU: INTERPRET DATA Examine the top and middle graphs in Figure 54-5. Are these examples of exponential...

Related questions
Question
In this experiment, what is(are) the control, independant and dependent factor(s)?
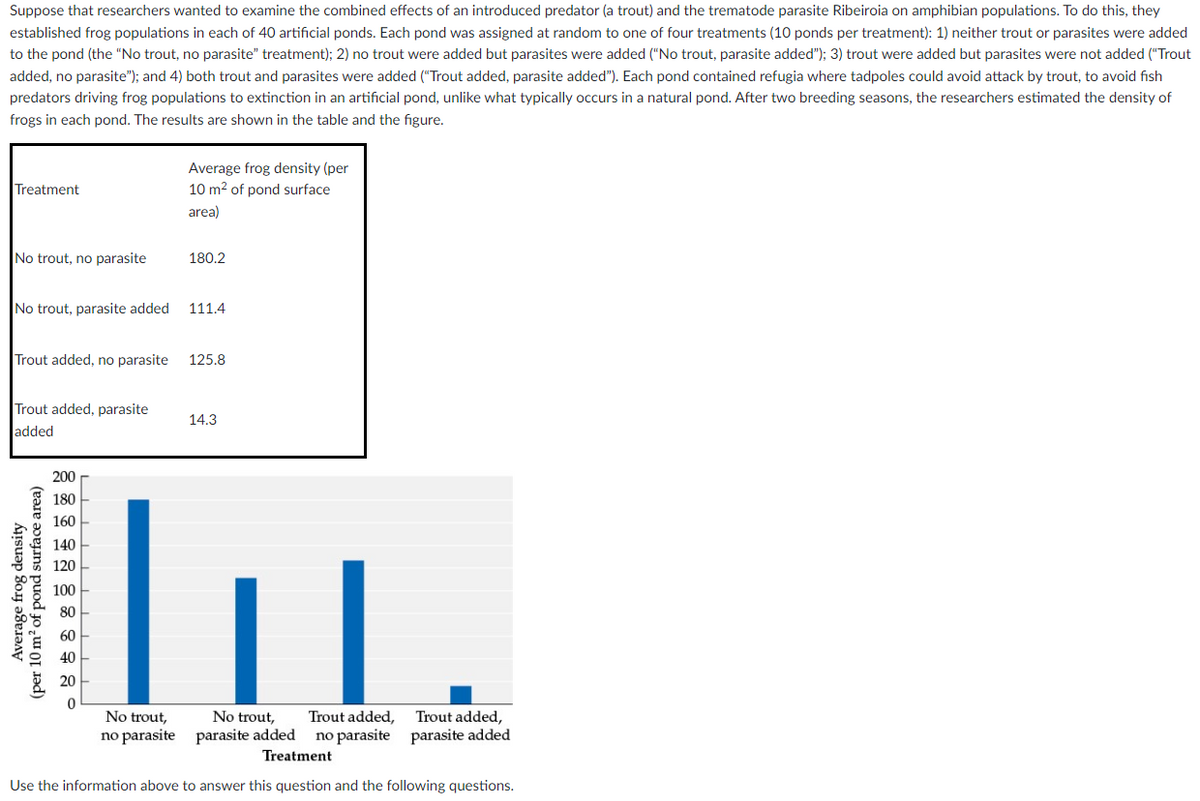
Transcribed Image Text:Suppose that researchers wanted to examine the combined effects of an introduced predator (a trout) and the trematode parasite Ribeiroia on amphibian populations. To do this, they
established frog populations in each of 40 artificial ponds. Each pond was assigned at random to one of four treatments (10 ponds per treatment): 1) neither trout or parasites were added
to the pond (the "No trout, no parasite" treatment); 2) no trout were added but parasites were added ("No trout, parasite added"); 3) trout were added but parasites were not added ("Trout
added, no parasite"); and 4) both trout and parasites were added ("Trout added, parasite added"). Each pond contained refugia where tadpoles could avoid attack by trout, to avoid fish
predators driving frog populations to extinction in an artificial pond, unlike what typically occurs in a natural pond. After two breeding seasons, the researchers estimated the density of
frogs in each pond. The results are shown in the table and the figure.
Treatment
No trout, no parasite
No trout, parasite added
Trout added, no parasite
Trout added, parasite
added
Average frog density
(per 10 m² of pond surface area)
200
180
160
140
120
100
80
60
40
20
0
Average frog density (per
10 m² of pond surface
area)
180.2
111.4
125.8
14.3
No trout,
Trout added,
No trout,
Trout added,
no parasite parasite added no parasite parasite added
Treatment
Use the information above to answer this question and the following questions.
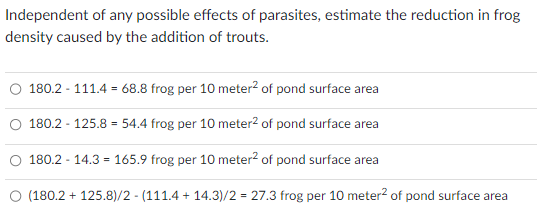
Transcribed Image Text:Independent of any possible effects of parasites, estimate the reduction in frog
density caused by the addition of trouts.
180.2 - 111.4 68.8 frog per 10 meter² of pond surface area
180.2 - 125.8 = 54.4 frog per 10 meter² of pond surface area
180.2 - 14.3=165.9 frog per 10 meter² of pond surface area
(180.2 + 125.8)/2-(111.4 +14.3)/2 = 27.3 frog per 10 meter² of pond surface area
Expert Solution
This question has been solved!
Explore an expertly crafted, step-by-step solution for a thorough understanding of key concepts.

This is a popular solution!

Trending now
This is a popular solution!

Step by step
Solved in 3 steps

Knowledge Booster


Learn more about
Need a deep-dive on the concept behind this application? Look no further. Learn more about this topic, biology and related others by exploring similar questions and additional content below.Recommended textbooks for you
Biology (MindTap Course List)
Biology
ISBN:
9781337392938
Author:
Eldra Solomon, Charles Martin, Diana W. Martin, Linda R. Berg
Publisher:
Cengage Learning
Biology (MindTap Course List)
Biology
ISBN:
9781337392938
Author:
Eldra Solomon, Charles Martin, Diana W. Martin, Linda R. Berg
Publisher:
Cengage Learning