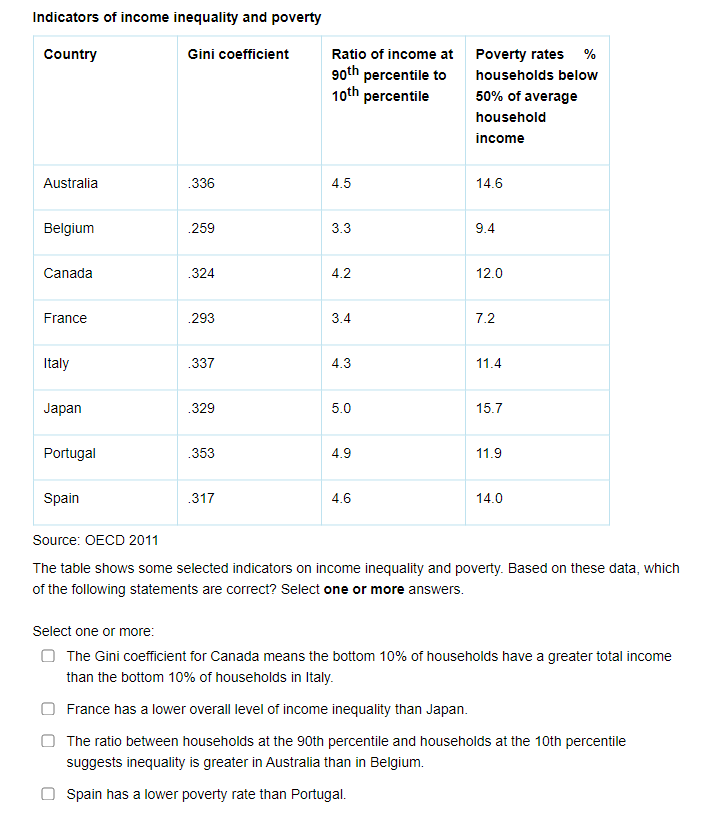
Indicators of income inequality and poverty Country Gini coefficient Australia Belgium Canada France Italy Japan Portugal Spain .336 .259 .324 .293 .337 .329 .353 .317 Ratio of income at 90th percentile to 10th percentile 4.5 3.3 4.2 3.4 4.3 5.0 4.9 4.6 Poverty rates % households below 50% of average household income 14.6 9.4 12.0 7.2 11.4 15.7 11.9 14.0 Source: OECD 2011 The table shows some selected indicators on income inequality and poverty. Based on these data, which of the following statements are correct? Select one or more answers. Select one or more: The Gini coefficient for Canada means the bottom 10% of households have a greater total income than the bottom 10% of households in Italy. France has a lower overall level of income inequality than Japan. The ratio between households at the 90th percentile and households at the 10th percentile suggests inequality is greater in Australia than in Belgium. Spain has a lower poverty rate than Portugal.
Indicators of income inequality and poverty Country Gini coefficient Australia Belgium Canada France Italy Japan Portugal Spain .336 .259 .324 .293 .337 .329 .353 .317 Ratio of income at 90th percentile to 10th percentile 4.5 3.3 4.2 3.4 4.3 5.0 4.9 4.6 Poverty rates % households below 50% of average household income 14.6 9.4 12.0 7.2 11.4 15.7 11.9 14.0 Source: OECD 2011 The table shows some selected indicators on income inequality and poverty. Based on these data, which of the following statements are correct? Select one or more answers. Select one or more: The Gini coefficient for Canada means the bottom 10% of households have a greater total income than the bottom 10% of households in Italy. France has a lower overall level of income inequality than Japan. The ratio between households at the 90th percentile and households at the 10th percentile suggests inequality is greater in Australia than in Belgium. Spain has a lower poverty rate than Portugal.

Principles of Microeconomics
7th Edition
ISBN:9781305156050
Author:N. Gregory Mankiw
Publisher:N. Gregory Mankiw
Chapter20: Income Inequality And Poverty
Section: Chapter Questions
Problem 2CQQ

Related questions
Question
Transcribed Image Text:Indicators of income inequality and poverty
Country
Gini coefficient
Australia
Belgium
Canada
France
Italy
Japan
Portugal
Spain
.336
259
.324
.293
.337
.329
.353
.317
Ratio of income at
90th percentile to
10th percentile
4.5
3.3
4.2
3.4
4.3
5.0
4.9
4.6
Poverty rates %
households below
50% of average
household
income
14.6
9.4
12.0
7.2
11.4
15.7
11.9
14.0
Source: OECD 2011
The table shows some selected indicators on income inequality and poverty. Based on these data, which
of the following statements are correct? Select one or more answers.
Select one or more:
The Gini coefficient for Canada means the bottom 10% of households have a greater total income
than the bottom 10% of households in Italy.
France has a lower overall level of income inequality than Japan.
The ratio between households at the 90th percentile and households at the 10th percentile
suggests inequality is greater in Australia than in Belgium.
Spain has a lower poverty rate than Portugal.
Expert Solution
This question has been solved!
Explore an expertly crafted, step-by-step solution for a thorough understanding of key concepts.

Step by step
Solved in 4 steps

Knowledge Booster


Learn more about
Need a deep-dive on the concept behind this application? Look no further. Learn more about this topic, economics and related others by exploring similar questions and additional content below.Recommended textbooks for you
Principles of Microeconomics
Economics
ISBN:
9781305156050
Author:
N. Gregory Mankiw
Publisher:
Cengage Learning

Microeconomics: Principles & Policy
Economics
ISBN:
9781337794992
Author:
William J. Baumol, Alan S. Blinder, John L. Solow
Publisher:
Cengage Learning

Principles of Economics 2e
Economics
ISBN:
9781947172364
Author:
Steven A. Greenlaw; David Shapiro
Publisher:
OpenStax
Principles of Microeconomics
Economics
ISBN:
9781305156050
Author:
N. Gregory Mankiw
Publisher:
Cengage Learning
Microeconomics: Principles & Policy
Economics
ISBN:
9781337794992
Author:
William J. Baumol, Alan S. Blinder, John L. Solow
Publisher:
Cengage Learning
Principles of Economics 2e
Economics
ISBN:
9781947172364
Author:
Steven A. Greenlaw; David Shapiro
Publisher:
OpenStax

Exploring Economics
Economics
ISBN:
9781544336329
Author:
Robert L. Sexton
Publisher:
SAGE Publications, Inc


Economics (MindTap Course List)
Economics
ISBN:
9781337617383
Author:
Roger A. Arnold
Publisher:
Cengage Learning