INExi questIoN eights (g) of a Sample Bag of Candy The data given to the right includes data from 45 candies, and 9 of them are red. The company that makes the candy claims that 32% of its candies are red. Use the sample data to construct a 95% confidence interval estimate of the percentage of red candies. What do you conclude about the claim of 32%? Red Blue Brown Green Yellow 0.954 0.925 0.916 0.784 0.996 0.924 0.805 0.742 0.992 0.867 ..... 0.808 0.759 0.954 0.973 0.882 0.735 0.921 Construct a 95% confidence interval estimate of the population percentage of candies that are red. 0.788 0.915 0.989 0.796 0.856 0.807 0.784 0.713 0.731 0.821 0.828 0.795 0.919 %
INExi questIoN eights (g) of a Sample Bag of Candy The data given to the right includes data from 45 candies, and 9 of them are red. The company that makes the candy claims that 32% of its candies are red. Use the sample data to construct a 95% confidence interval estimate of the percentage of red candies. What do you conclude about the claim of 32%? Red Blue Brown Green Yellow 0.954 0.925 0.916 0.784 0.996 0.924 0.805 0.742 0.992 0.867 ..... 0.808 0.759 0.954 0.973 0.882 0.735 0.921 Construct a 95% confidence interval estimate of the population percentage of candies that are red. 0.788 0.915 0.989 0.796 0.856 0.807 0.784 0.713 0.731 0.821 0.828 0.795 0.919 %

College Algebra (MindTap Course List)
12th Edition
ISBN:9781305652231
Author:R. David Gustafson, Jeff Hughes
Publisher:R. David Gustafson, Jeff Hughes
Chapter8: Sequences, Series, And Probability
Section8.7: Probability
Problem 58E: What is meant by the sample space of an experiment?

Related questions
Question
Transcribed Image Text:Nexi questio
Jeights (g) of a Sample Bag of Candy
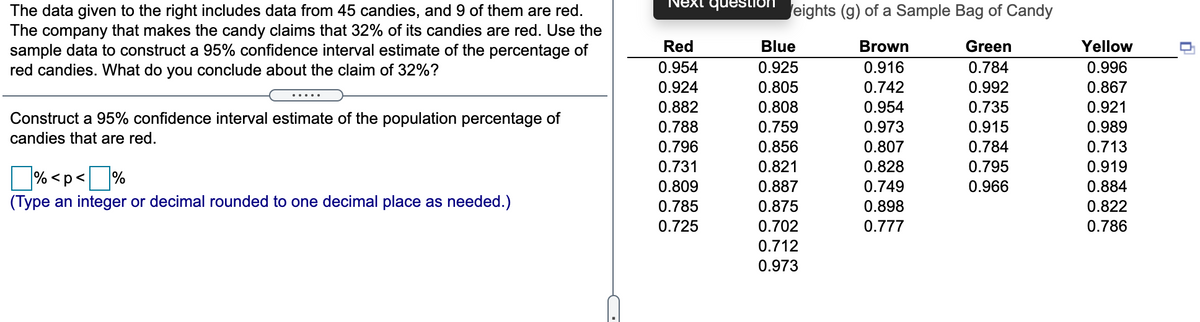
The data given to the right includes data from 45 candies, and 9 of them are red.
The company that makes the candy claims that 32% of its candies are red. Use the
sample data to construct a 95% confidence interval estimate of the percentage of
red candies. What do you conclude about the claim of 32%?
Red
Blue
Brown
Green
Yellow
0.954
0.925
0.916
0.784
0.996
0.924
0.805
0.742
0.992
0.867
.....
0.882
0.808
0.954
0.735
0.921
Construct a 95% confidence interval estimate of the population percentage of
candies that are red.
0.788
0.759
0.973
0.915
0.989
0.856
0.821
0.796
0.807
0.784
0.713
0.731
0.828
0.795
0.919
% <p< %
0.809
0.887
0.749
0.966
0.884
(Type an integer or decimal rounded to one decimal place as needed.)
0.785
0.875
0.898
0.822
0.725
0.702
0.777
0.786
0.712
0.973
Expert Solution
This question has been solved!
Explore an expertly crafted, step-by-step solution for a thorough understanding of key concepts.

Step by step
Solved in 2 steps with 1 images

Recommended textbooks for you
College Algebra (MindTap Course List)
Algebra
ISBN:
9781305652231
Author:
R. David Gustafson, Jeff Hughes
Publisher:
Cengage Learning
College Algebra (MindTap Course List)
Algebra
ISBN:
9781305652231
Author:
R. David Gustafson, Jeff Hughes
Publisher:
Cengage Learning