Instructions: Modify values in the SETTINGS window of the interactive tool to answer the questions below. Ater each question, click the "Reser button in the upper-right corner a) Increase the "initial Value" setting for Country X Which of the following describes the changes in the graph? O The purple line starts at the same height but rises faster The vertical intercept of the green line rises O The vertical intercept of the purple line rises O The green ine starts at the same height but rises faster b) Using the slider, change the "Growth Rate" setting for Country Y to 3%. Report the "Value in 10 Years" for country Y from the CALCULATIONS window C) Experiment with the "Initial Value" for Country Y. What must that value be so that the two curves shown in the graph intersect at 200 years?
Instructions: Modify values in the SETTINGS window of the interactive tool to answer the questions below. Ater each question, click the "Reser button in the upper-right corner a) Increase the "initial Value" setting for Country X Which of the following describes the changes in the graph? O The purple line starts at the same height but rises faster The vertical intercept of the green line rises O The vertical intercept of the purple line rises O The green ine starts at the same height but rises faster b) Using the slider, change the "Growth Rate" setting for Country Y to 3%. Report the "Value in 10 Years" for country Y from the CALCULATIONS window C) Experiment with the "Initial Value" for Country Y. What must that value be so that the two curves shown in the graph intersect at 200 years?

Chapter1: Making Economics Decisions
Section: Chapter Questions
Problem 1QTC

Related questions
Question
2
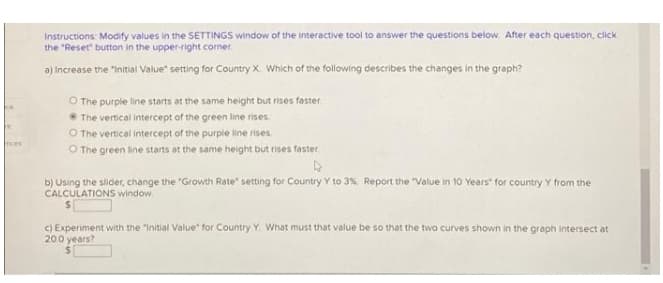
Transcribed Image Text:Instructions: Modify values in the SETTINGS window of the interactive tool to answer the questions below. After each question, click
the "Reset button in the upper-right corner
a) Increase the "Initial Value" setting for Country X. Which of the following describes the changes in the graph?
O The purple line starts at the same height but rises faster
The vertical intercept of the green line rises
O The vertical intercept of the purple line rises.
O The green line starts at the same height but rises faster
nces
b) Using the slider, change the "Growth Rate" setting for Country Y to 3%. Report the "Value in 10 Years" for country Y from the
CALCULATIONS window.
c) Experiment with the "Initial Value" for Country Y. What must that value be so that the two curves shown in the graph intersect at
200 years?
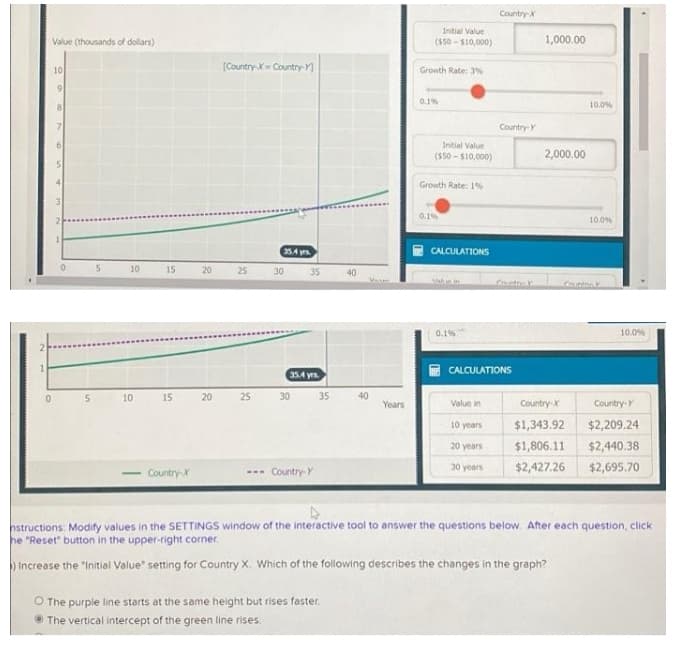
Transcribed Image Text:Country X
Initial Value
Value (thousands of dollars)
($50 - S10,000)
1,000.00
[Country-X Country-
10
Growth Rate: 3%
0.1%
8.
10.0%
Country- Y
Initial Value
($50 - $10,000)
2,000.00
Growth Rate: 1%
3.
0.1%
10.0%
35.4 ys
CALCULATIONS
10
15
20
25 30
35
40
0.1%
10.0%
CALCULATIONS
35.4 yrs
10
15
20
25 30
35
40
Years
Value in
Country-X
Country-Y
10 years
$1,343.92
$2,209.24
20 years
$1,806.11
$2,440.38
Country-X
Country-Y
30 years
$2,427.26
$2,695.70
hstructions: Modify values in the SETTINGS window of the interactive tool to answer the questions below. After each question, click
he "Reset" button in the upper-right corner.
increase the "initial Value" setting for Country X. Which of the following describes the changes in the graph?
O The purple line starts at the same height but rises faster.
The vertical intercept of the green line rises.
Expert Solution
This question has been solved!
Explore an expertly crafted, step-by-step solution for a thorough understanding of key concepts.

This is a popular solution!

Trending now
This is a popular solution!

Step by step
Solved in 2 steps

Knowledge Booster


Learn more about
Need a deep-dive on the concept behind this application? Look no further. Learn more about this topic, economics and related others by exploring similar questions and additional content below.Recommended textbooks for you

Principles of Economics (12th Edition)
Economics
ISBN:
9780134078779
Author:
Karl E. Case, Ray C. Fair, Sharon E. Oster
Publisher:
PEARSON

Engineering Economy (17th Edition)
Economics
ISBN:
9780134870069
Author:
William G. Sullivan, Elin M. Wicks, C. Patrick Koelling
Publisher:
PEARSON
Principles of Economics (12th Edition)
Economics
ISBN:
9780134078779
Author:
Karl E. Case, Ray C. Fair, Sharon E. Oster
Publisher:
PEARSON
Engineering Economy (17th Edition)
Economics
ISBN:
9780134870069
Author:
William G. Sullivan, Elin M. Wicks, C. Patrick Koelling
Publisher:
PEARSON

Principles of Economics (MindTap Course List)
Economics
ISBN:
9781305585126
Author:
N. Gregory Mankiw
Publisher:
Cengage Learning

Managerial Economics: A Problem Solving Approach
Economics
ISBN:
9781337106665
Author:
Luke M. Froeb, Brian T. McCann, Michael R. Ward, Mike Shor
Publisher:
Cengage Learning

Managerial Economics & Business Strategy (Mcgraw-…
Economics
ISBN:
9781259290619
Author:
Michael Baye, Jeff Prince
Publisher:
McGraw-Hill Education