Grear Tire Company has produced a new tire with an estimated mean lifetime mileage of 33,500 miles. Management also believes that the standard deviation is 4,500 miles and that tire mileage is normally distributed. To promote the new tire, Grear has offered to refund a portion of the purchase price if the tire fails to reach 30,000 miles before the tire needs to be replaced. Specifically, for tires with a lifetime below 30,000 miles, Grear will refund a customer $1 per 100 miles short of 30,000. Construct a simulation model to answer the following questions. (Use at least 1,000 trials.) (a) For each tire sold, what is the average cost of the promotion (in $)? (Round your answer to two decimal places.) $ 3.70 x (b) What is the probability that Grear will refund more than $25 for a tire? (Round your answer to three decimal places.) 0.037 X
Q: a) The EOQ for the workbooks is 444 (round your response to the nearest whole number). b) What are…
A: The best order amount of raw materials for a corporate organization to reduce holding costs, order…
Q: Organisations face an important decision in choosing how supplier performance is to be measured.…
A: Businesses that have a solid supply chain have a far better chance of succeeding. Maintaining solid…
Q: how would you input the formula into exce
A: FIT = Forcast Including Trend FIT = Ft + Tt Ft = FITt-1 + a {(At-1) -(FITt-1)} Tt = Tt-1 + b…
Q: Assume that all customer groups eat both dinner and dessert. Estimate the maximum number of customer…
A: Little’s Law is a mathematical equation that helps in calculating the number of servers required to…
Q: How can Foxconn improve its ethical decision-making and corporate social responsibility?
A: By enhancing the social and environmental circumstances in which it works, a firm demonstrates its…
Q: Auto pistons at Wemming Chung's plant in Shanghai are produced in a forging process, and the…
A: Find the Calculation methods: X (Mean) Double bar = Average of mean (x) R (Range) bar = Average…
Q: Q-1)Find the optimal solution for the Lpp below by using the graphical method ? Max z=X1+X2 S.TO…
A: Find the Calculations below: Graph: Based on the above graph we conclude that the feasible region…
Q: How can I effectively collect the necessary information to write a comprehensive operations manual?
A: Operations Manual: Operations Manual is defined as it is a well-structured document…
Q: Max Z = 3X1 + 4X2 Sub to: X1 + X2 ≤ 20 2X1 + 3X2 ≤ 50 And X1, X2 ≥ 0 (SOLVE MANUALLY USING…
A: Linear programming is a mathematical technique that is also used in operations management…
Q: the MAD turned out great however the MSE is off
A: Mean squared error is a measure of the accuracy of a forecast. It is often used in cases where the…
Q: Forecasting as you have read isn't an exact science. There can be many intangibles that you just…
A: Forecasting is the method through which an estimated of the future course of events is done in…
Q: A big box store sells a lawn mower. Annual demand for the lawn mower is 600 units. The ordering…
A: Annual Demand = D = 600 units Ordering cost per order = S = $20 Annual Holding Cost per unit = H =…
Q: Part e & f is incorrect e.)Ls=3.125+0.75=3.875 ships f.) Lq=(6^2(1/6)^2+0.75^2)/2(1-.75)=3.125…
A: Given that: Arrival rate (A) 6 Service rate (S) 8 number of servers C 1
Q: Why are healthcare organizations investing in data warehouse systems and analytics? List the top 4…
A: A particular form of information administration platform called a "data warehouse" is intended to…
Q: Case Study: Apple is famous for its attractive and highly prized electronics, including iPhones, Mac…
A: Business Environment - In today's era of globalization and digitization, it has become difficult for…
Q: An appliance store sells microwaves at a steady rate throughout the year. Each microwave costs the…
A:
Q: sign capacity and effective capacity. Provid On important? enter has the physical ability to handle…
A: A system's capacity is its ability to produce items or provide services within a certain time frame.…
Q: The forecast error in a given time period is obtained by subtracting the actual value of the…
A: Forecasting shows the procedure of taking more instructed projections by utilizing recorded info as…
Q: Briefly explain what are the roles of cGMP in the Quality Control (QC) unit in the pharmaceutical…
A: The Food and Drug Administration has established Current Good Manufacturing Practice guidelines,…
Q: A food manufacturer wants to locate a warehouse to serve its major The customers, annual volume, and…
A: Center of gravity method is a model which considering the annual volume and the coordinate values…
Q: b A manufacturer of Golf Cart purchases the seat portion of the stroller from a supplier who lists…
A: If the calculated EOQ falls in given range, the EOQ will be considered else the lower limit of the…
Q: An ad agency tracks the complaints, by week received, about the billboards in its city:…
A: Find the answers below: The Suitable chart is C-chart. C- Chart: C Chart is defined as it is an…
Q: A home improvement store sells hydrangea plants during the spring planting season. The hydrangeas…
A: Cost = $15 per unit Selling price = $45 per unit Salvage value = $7 per unit Service level = 99%…
Q: In the above question Athena Grocery is able to increase the month en salvage price to $ 0.69 /pack.…
A: The optimal order quantity is a crucial factor in the success of any business. It is the number of…
Q: Quality is a new competitive weapon" Justify the statement.
A: The quality of a product or service is the degree to which the product or service possesses…
Q: COSO ERM 2017 risk management system for evaluating an organization's prospective and real threats…
A: ERM-Integrated Framework comprises of the eight components: 1. Internal Environment-The board sets a…
Q: # search any Examples for LPP to help you understanding the Linear programming problem Formulation
A: In this question, let me provide an example of an LPP or Linear programming problem, here, I have…
Q: Purchasing materials in higher volumes has the advantage of reducing ______. Multiple Choice…
A: Purchasing volumes play a significant role in overall cost of production. Production volumes depend…
Q: Solve the following linear programming problem using simplex method. A diet for a sick person must…
A: Let Food A = x1 and Food B = x2
Q: How many units should you hold in finished-goods in a Replenishment Pull System if the daily demand…
A: Container required = Total requirement during lead time / Units per container Total requirement…
Q: Provide strategies the manufacturers can use to counteract conflict in supply chain management.
A: Culture, technology, worldwide operations, cost-cutting initiatives, change management, lack of…
Q: If the part fails and a spare is not available, it will take The cost for idle equipment is $500 per…
A: The optimal order quantity is the number of units a company needs to order to get the best possible…
Q: 4. Organic Grains LLC uses statistical process control to ensure that its health-conscious,…
A: Given data:
Q: You are planning the new layout for the local branch of the Sixth Ninth Bank. You are considering…
A: As per the given description of the question, the following information is extracted. Number of…
Q: Your supervisor, Lisa Lehmann, has asked that you report on the output of a machine on the factory…
A: Find the Calculation methods below: Upper Control Limit (UCLx) = Ẍ + A2 ṜLower Control Limit (LCLx)…
Q: The university administration wants to ensure that all 1,200 students are able to submit their files…
A: The mean number of things together in a system, the average pace at which new items are added, and,…
Q: economics in supply chain management
A: Social-economic, political, governmental, or environmental problems that have an impact on the…
Q: Expando, Inc., is considering the possibility of building an additional factory that would produce a…
A: This is a diagrammatic representation of decisions available to choose from considering the…
Q: Eastman Publishing Company is considering publishing an electronic textbook about spreadsheet…
A:
Q: Based on the following table. Bid Ask EURUSD 1M FWD 7.05 7.34 EURUSD 2M FWD 14.99 15.15 EURUSD 3M…
A: Given, Spot rate: Bid : 1.1411 Ask : 1.1422 3M Forward rate: Bid = 1.1411 + 0.002257 = 1.143357 Ask…
Q: Ram Roy's firm has developed the following supply, demand, cost, and inventory data Period 1 2 3…
A: Find the Calculation methods below: Given details: Period 1 Period 2 Period 3 Demand 40 60…
Q: Suppose that a task in a project has the following time estimates: to=optimistic completion…
A: Given data: Optimistic time period (to) = 10 weeks Most likely completion period (tm) =17 weeks…
Q: agement capacity planning and control in business. Select a business to illustrate your…
A: The maximum level of output that a corporation can produce for its goods and services depends on its…
Q: g system help the hospitals?
A: The processes a hospital takes to get the medical supplies, goods, or services it requires can be…
Q: Using trend projection, develop a formula to predict sales for years 11 and 12. You have to show all…
A: The given data stated below, Year TV Sales 1 150 2 300 3 480 4 600 5 630 6 640 7…
Q: 13. The Advanced Tech Company has a project to design an integrated information database for a major…
A: Project crashing is a process which helps to reduce the total completion time using additional…
Q: The results of inspection of DNA samples taken over the past 10 days are given below. Sample size is…
A: Find the Calculation methods below: Fraction Defectives (p) = Number of Defectives (np)Sample Size…
Q: For which items should we keep our own inventory?
A: Inventory refers to good, merchandise and materials that are held by business for selling in the…
Q: What are the 7 layout strategies
A: Layout is a system which is designed to facilitate the efficient flow of materials through the…
Q: The following table shows the number of televisions sold over the last ten years at a local…
A: Remember formulas: X bar = ∑X / n Y bar = ∑ Y/ n b =( ∑ X*Y) - n× X bar × Y bar) / (∑X^2-n× (X…
i do not know why my answers are incorrect
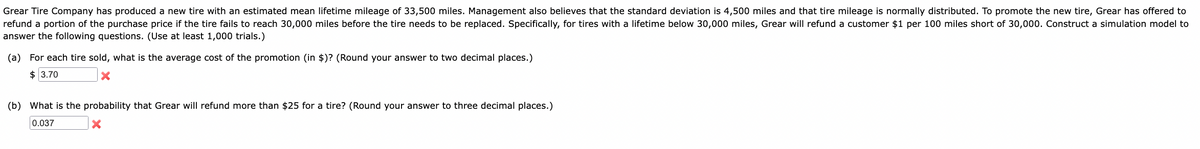
Trending now
This is a popular solution!
Step by step
Solved in 4 steps with 4 images
- An automobile manufacturer is considering whether to introduce a new model called the Racer. The profitability of the Racer depends on the following factors: The fixed cost of developing the Racer is triangularly distributed with parameters 3, 4, and 5, all in billions. Year 1 sales are normally distributed with mean 200,000 and standard deviation 50,000. Year 2 sales are normally distributed with mean equal to actual year 1 sales and standard deviation 50,000. Year 3 sales are normally distributed with mean equal to actual year 2 sales and standard deviation 50,000. The selling price in year 1 is 25,000. The year 2 selling price will be 1.05[year 1 price + 50 (% diff1)] where % diff1 is the number of percentage points by which actual year 1 sales differ from expected year 1 sales. The 1.05 factor accounts for inflation. For example, if the year 1 sales figure is 180,000, which is 10 percentage points below the expected year 1 sales, then the year 2 price will be 1.05[25,000 + 50( 10)] = 25,725. Similarly, the year 3 price will be 1.05[year 2 price + 50(% diff2)] where % diff2 is the percentage by which actual year 2 sales differ from expected year 2 sales. The variable cost in year 1 is triangularly distributed with parameters 10,000, 12,000, and 15,000, and it is assumed to increase by 5% each year. Your goal is to estimate the NPV of the new car during its first three years. Assume that the company is able to produce exactly as many cars as it can sell. Also, assume that cash flows are discounted at 10%. Simulate 1000 trials to estimate the mean and standard deviation of the NPV for the first three years of sales. Also, determine an interval such that you are 95% certain that the NPV of the Racer during its first three years of operation will be within this interval.The annual demand for Prizdol, a prescription drug manufactured and marketed by the NuFeel Company, is normally distributed with mean 50,000 and standard deviation 12,000. Assume that demand during each of the next 10 years is an independent random number from this distribution. NuFeel needs to determine how large a Prizdol plant to build to maximize its expected profit over the next 10 years. If the company builds a plant that can produce x units of Prizdol per year, it will cost 16 for each of these x units. NuFeel will produce only the amount demanded each year, and each unit of Prizdol produced will sell for 3.70. Each unit of Prizdol produced incurs a variable production cost of 0.20. It costs 0.40 per year to operate a unit of capacity. a. Among the capacity levels of 30,000, 35,000, 40,000, 45,000, 50,000, 55,000, and 60,000 units per year, which level maximizes expected profit? Use simulation to answer this question. b. Using the capacity from your answer to part a, NuFeel can be 95% certain that actual profit for the 10-year period will be between what two values?Although the normal distribution is a reasonable input distribution in many situations, it does have two potential drawbacks: (1) it allows negative values, even though they may be extremely improbable, and (2) it is a symmetric distribution. Many situations are modelled better with a distribution that allows only positive values and is skewed to the right. Two of these that have been used in many real applications are the gamma and lognormal distributions. @RISK enables you to generate observations from each of these distributions. The @RISK function for the gamma distribution is RISKGAMMA, and it takes two arguments, as in =RISKGAMMA(3,10). The first argument, which must be positive, determines the shape. The smaller it is, the more skewed the distribution is to the right; the larger it is, the more symmetric the distribution is. The second argument determines the scale, in the sense that the product of it and the first argument equals the mean of the distribution. (The mean in this example is 30.) Also, the product of the second argument and the square root of the first argument is the standard deviation of the distribution. (In this example, it is 3(10=17.32.) The @RISK function for the lognormal distribution is RISKLOGNORM. It has two arguments, as in =RISKLOGNORM(40,10). These arguments are the mean and standard deviation of the distribution. Rework Example 10.2 for the following demand distributions. Do the simulated outputs have any different qualitative properties with these skewed distributions than with the triangular distribution used in the example? a. Gamma distribution with parameters 2 and 85 b. Gamma distribution with parameters 5 and 35 c. Lognormal distribution with mean 170 and standard deviation 60
- Dilberts Department Store is trying to determine how many Hanson T-shirts to order. Currently the shirts are sold for 21, but at later dates the shirts will be offered at a 10% discount, then a 20% discount, then a 40% discount, then a 50% discount, and finally a 60% discount. Demand at the full price of 21 is believed to be normally distributed with mean 1800 and standard deviation 360. Demand at various discounts is assumed to be a multiple of full-price demand. These multiples, for discounts of 10%, 20%, 40%, 50%, and 60% are, respectively, 0.4, 0.7, 1.1, 2, and 50. For example, if full-price demand is 2500, then at a 10% discount customers would be willing to buy 1000 T-shirts. The unit cost of purchasing T-shirts depends on the number of T-shirts ordered, as shown in the file P10_36.xlsx. Use simulation to determine how many T-shirts the company should order. Model the problem so that the company first orders some quantity of T-shirts, then discounts deeper and deeper, as necessary, to sell all of the shirts.Suppose you have invested 25% of your portfolio in four different stocks. The mean and standard deviation of the annual return on each stock are shown in the file P11_46.xlsx. The correlations between the annual returns on the four stocks are also shown in this file. a. What is the probability that your portfolios annual return will exceed 30%? b. What is the probability that your portfolio will lose money during the year?Based on Babich (1992). Suppose that each week each of 300 families buys a gallon of orange juice from company A, B, or C. Let pA denote the probability that a gallon produced by company A is of unsatisfactory quality, and define pB and pC similarly for companies B and C. If the last gallon of juice purchased by a family is satisfactory, the next week they will purchase a gallon of juice from the same company. If the last gallon of juice purchased by a family is not satisfactory, the family will purchase a gallon from a competitor. Consider a week in which A families have purchased juice A, B families have purchased juice B, and C families have purchased juice C. Assume that families that switch brands during a period are allocated to the remaining brands in a manner that is proportional to the current market shares of the other brands. For example, if a customer switches from brand A, there is probability B/(B + C) that he will switch to brand B and probability C/(B + C) that he will switch to brand C. Suppose that the market is currently divided equally: 10,000 families for each of the three brands. a. After a year, what will the market share for each firm be? Assume pA = 0.10, pB = 0.15, and pC = 0.20. (Hint: You will need to use the RISKBINOMLAL function to see how many people switch from A and then use the RISKBENOMIAL function again to see how many switch from A to B and from A to C. However, if your model requires more RISKBINOMIAL functions than the number allowed in the academic version of @RISK, remember that you can instead use the BENOM.INV (or the old CRITBENOM) function to generate binomially distributed random numbers. This takes the form =BINOM.INV (ntrials, psuccess, RAND()).) b. Suppose a 1% increase in market share is worth 10,000 per week to company A. Company A believes that for a cost of 1 million per year it can cut the percentage of unsatisfactory juice cartons in half. Is this worthwhile? (Use the same values of pA, pB, and pC as in part a.)
- Use @RISK to analyze the sweatshirt situation in Problem 14 of the previous section. Do this for the discrete distributions given in the problem. Then do it for normal distributions. For the normal case, assume that the regular demand is normally distributed with mean 9800 and standard deviation 1300 and that the demand at the reduced price is normally distributed with mean 3800 and standard deviation 1400.Play Things is developing a new Lady Gaga doll. The company has made the following assumptions: The doll will sell for a random number of years from 1 to 10. Each of these 10 possibilities is equally likely. At the beginning of year 1, the potential market for the doll is two million. The potential market grows by an average of 4% per year. The company is 95% sure that the growth in the potential market during any year will be between 2.5% and 5.5%. It uses a normal distribution to model this. The company believes its share of the potential market during year 1 will be at worst 30%, most likely 50%, and at best 60%. It uses a triangular distribution to model this. The variable cost of producing a doll during year 1 has a triangular distribution with parameters 15, 17, and 20. The current selling price is 45. Each year, the variable cost of producing the doll will increase by an amount that is triangularly distributed with parameters 2.5%, 3%, and 3.5%. You can assume that once this change is generated, it will be the same for each year. You can also assume that the company will change its selling price by the same percentage each year. The fixed cost of developing the doll (which is incurred right away, at time 0) has a triangular distribution with parameters 5 million, 7.5 million, and 12 million. Right now there is one competitor in the market. During each year that begins with four or fewer competitors, there is a 25% chance that a new competitor will enter the market. Year t sales (for t 1) are determined as follows. Suppose that at the end of year t 1, n competitors are present (including Play Things). Then during year t, a fraction 0.9 0.1n of the company's loyal customers (last year's purchasers) will buy a doll from Play Things this year, and a fraction 0.2 0.04n of customers currently in the market ho did not purchase a doll last year will purchase a doll from Play Things this year. Adding these two provides the mean sales for this year. Then the actual sales this year is normally distributed with this mean and standard deviation equal to 7.5% of the mean. a. Use @RISK to estimate the expected NPV of this project. b. Use the percentiles in @ RISKs output to find an interval such that you are 95% certain that the companys actual NPV will be within this interval.Continuing the previous problem, assume, as in Problem 11, that the damage amount is normally distributed with mean 3000 and standard deviation 750. Run @RISK with 5000 iterations to simulate the amount you pay for damage. Compare your results with those in the previous problem. Does it appear to matter whether you assume a triangular distribution or a normal distribution for damage amounts? Why isnt this a totally fair comparison? (Hint: Use @RISKs Define Distributions tool to find the standard deviation for the triangular distribution.)