INTRODUCTORY STATSTICS STATS 101 One-Way Independent ANOVA Name: Download the SPSS file "Grades" from CANVAS. 1. Test the hypothesis that there is a difference among first-year, sophomore, junior, and senior students (variable = year) in the total number of points they earned in the class (total). Before doing this, indicate what type of ANOVA you will perform (ie., Independent or Dependent), state your null and alternative hypotheses, and the alpha level. Type of ANOVA: Dependent Step 1: H;: Ho: Not HO Step 2: a 0.01 Step 3: Descriptives Total points in class (max=125) 95% Confidence Interval for Mean. Lower Bound Maximum Minimum Upper Bound Std Error Std. Deviation Mean 111 84 59.78 130.22 8.185 14.177 FIRST-YEAR 95.00 120 75 107.49 3.438 93.04 14.985 100.26 SOPHOMORE 19 51 124 97.36 105.33 15.963 1.995 101.34 64 JUNIOR 65 121 92.27 106.04 3.278, 19 99 16 14.288 SENIOR 51 124 103.53 97.61 1493 15.299 100.57 Total 105 ANOVA Total points in class (max= 125) Sum of Sig Mean Square df Squares 57.022 238 869 Between Groups 171.066 239.333 Within Groups 24172.648 101 24343.714 104 Total Multiple Comparisons Total points in class (max= 125) Dependent Variable: Tukey HSD Mean Difference (- 95% Confidence Interval Upper Bound Lower Bound Sig. Std. Error S YEAR IN SCHOOL O YEAR IN SCHOOL -30.37 19.84 947 SOPHOMORE 9.611 FIRST-YEAR -5.263 17.53 -30.22 899 9.139 -6.344 -29.27 20.95 973 9.611 SENIOR -4.158 30.37 -19.84 947 9.611 FIRST-YEAR SOPHOMORE 5.263 9.48 -11.64 -1.081 4.042 JUNIOR 14.22 -12.01, 996 1.105 5.019 SENIOR 30.22 17,53 9.139 899 6.344 FIRST-YEAR JUNIOR -9.48 11.64 993 4.042 1.081 SOPHOMORE 12.74 -8.37 949 2.186 4.042 SENIOR -20.95 973 9.611 4.158 FIRST-YEAR SENIOR 12,01 996 -14.22 5.019 -1.105 SOPHOMORE 8.37 -12.74 949 -2,186 4.042 JUNIOR Significance df values= Are post-hoc tests needed? (Pick One): Yes No Based on the SPSS output, state the conclusion you reached. Specifically, indicate (1) whether you reject or did not reject the null hypothesis and (2) write up the results using the format you see on the board (make sure to include the results of the post-hoc tests only if needed).
INTRODUCTORY STATSTICS STATS 101 One-Way Independent ANOVA Name: Download the SPSS file "Grades" from CANVAS. 1. Test the hypothesis that there is a difference among first-year, sophomore, junior, and senior students (variable = year) in the total number of points they earned in the class (total). Before doing this, indicate what type of ANOVA you will perform (ie., Independent or Dependent), state your null and alternative hypotheses, and the alpha level. Type of ANOVA: Dependent Step 1: H;: Ho: Not HO Step 2: a 0.01 Step 3: Descriptives Total points in class (max=125) 95% Confidence Interval for Mean. Lower Bound Maximum Minimum Upper Bound Std Error Std. Deviation Mean 111 84 59.78 130.22 8.185 14.177 FIRST-YEAR 95.00 120 75 107.49 3.438 93.04 14.985 100.26 SOPHOMORE 19 51 124 97.36 105.33 15.963 1.995 101.34 64 JUNIOR 65 121 92.27 106.04 3.278, 19 99 16 14.288 SENIOR 51 124 103.53 97.61 1493 15.299 100.57 Total 105 ANOVA Total points in class (max= 125) Sum of Sig Mean Square df Squares 57.022 238 869 Between Groups 171.066 239.333 Within Groups 24172.648 101 24343.714 104 Total Multiple Comparisons Total points in class (max= 125) Dependent Variable: Tukey HSD Mean Difference (- 95% Confidence Interval Upper Bound Lower Bound Sig. Std. Error S YEAR IN SCHOOL O YEAR IN SCHOOL -30.37 19.84 947 SOPHOMORE 9.611 FIRST-YEAR -5.263 17.53 -30.22 899 9.139 -6.344 -29.27 20.95 973 9.611 SENIOR -4.158 30.37 -19.84 947 9.611 FIRST-YEAR SOPHOMORE 5.263 9.48 -11.64 -1.081 4.042 JUNIOR 14.22 -12.01, 996 1.105 5.019 SENIOR 30.22 17,53 9.139 899 6.344 FIRST-YEAR JUNIOR -9.48 11.64 993 4.042 1.081 SOPHOMORE 12.74 -8.37 949 2.186 4.042 SENIOR -20.95 973 9.611 4.158 FIRST-YEAR SENIOR 12,01 996 -14.22 5.019 -1.105 SOPHOMORE 8.37 -12.74 949 -2,186 4.042 JUNIOR Significance df values= Are post-hoc tests needed? (Pick One): Yes No Based on the SPSS output, state the conclusion you reached. Specifically, indicate (1) whether you reject or did not reject the null hypothesis and (2) write up the results using the format you see on the board (make sure to include the results of the post-hoc tests only if needed).

Glencoe Algebra 1, Student Edition, 9780079039897, 0079039898, 2018
18th Edition
ISBN:9780079039897
Author:Carter
Publisher:Carter
Chapter10: Statistics
Section10.3: Measures Of Spread
Problem 1GP

Related questions
Question
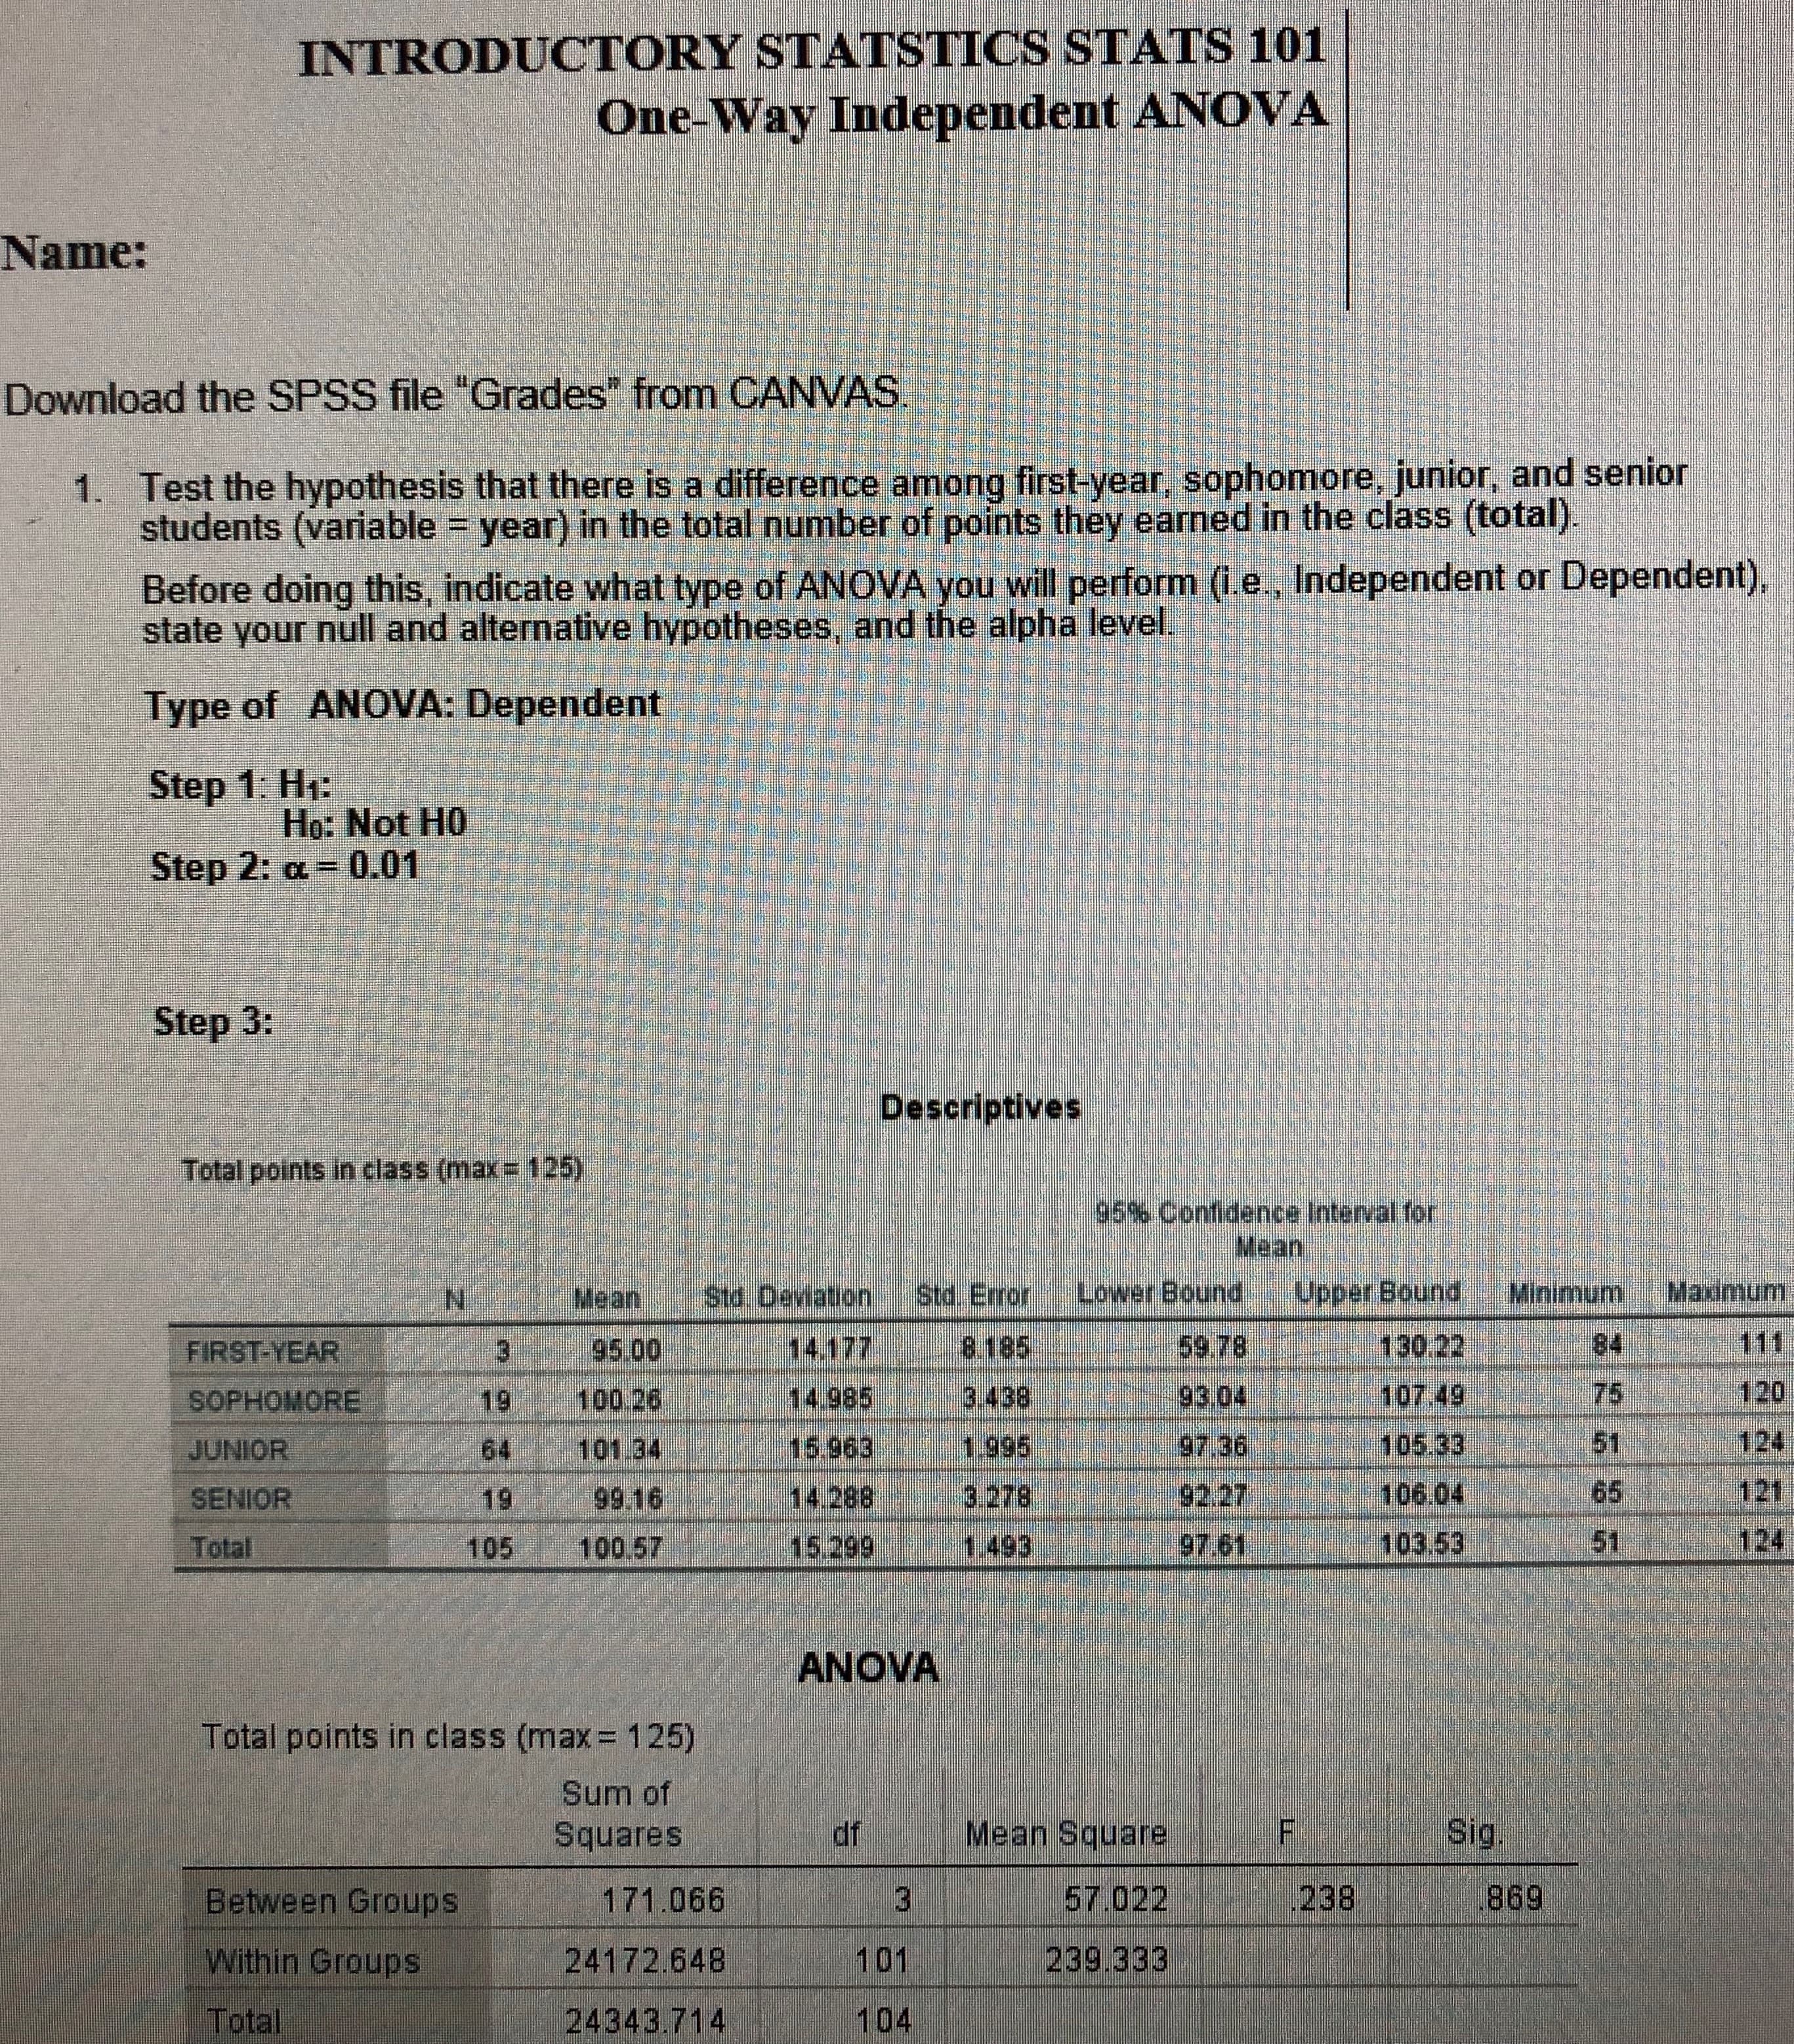
Transcribed Image Text:INTRODUCTORY STATSTICS STATS 101
One-Way Independent ANOVA
Name:
Download the SPSS file "Grades" from CANVAS.
1.
Test the hypothesis that there is a difference among first-year, sophomore, junior, and senior
students (variable = year) in the total number of points they earned in the class (total).
Before doing this, indicate what type of ANOVA you will perform (ie., Independent or Dependent),
state your null and alternative hypotheses, and the alpha level.
Type of ANOVA: Dependent
Step 1: H;:
Ho: Not HO
Step 2: a 0.01
Step 3:
Descriptives
Total points in class (max=125)
95% Confidence Interval for
Mean.
Lower Bound
Maximum
Minimum
Upper Bound
Std Error
Std. Deviation
Mean
111
84
59.78
130.22
8.185
14.177
FIRST-YEAR
95.00
120
75
107.49
3.438
93.04
14.985
100.26
SOPHOMORE
19
51
124
97.36
105.33
15.963
1.995
101.34
64
JUNIOR
65
121
92.27
106.04
3.278,
19 99 16
14.288
SENIOR
51
124
103.53
97.61
1493
15.299
100.57
Total
105
ANOVA
Total points in class (max= 125)
Sum of
Sig
Mean Square
df
Squares
57.022
238
869
Between Groups
171.066
239.333
Within Groups
24172.648
101
24343.714
104
Total
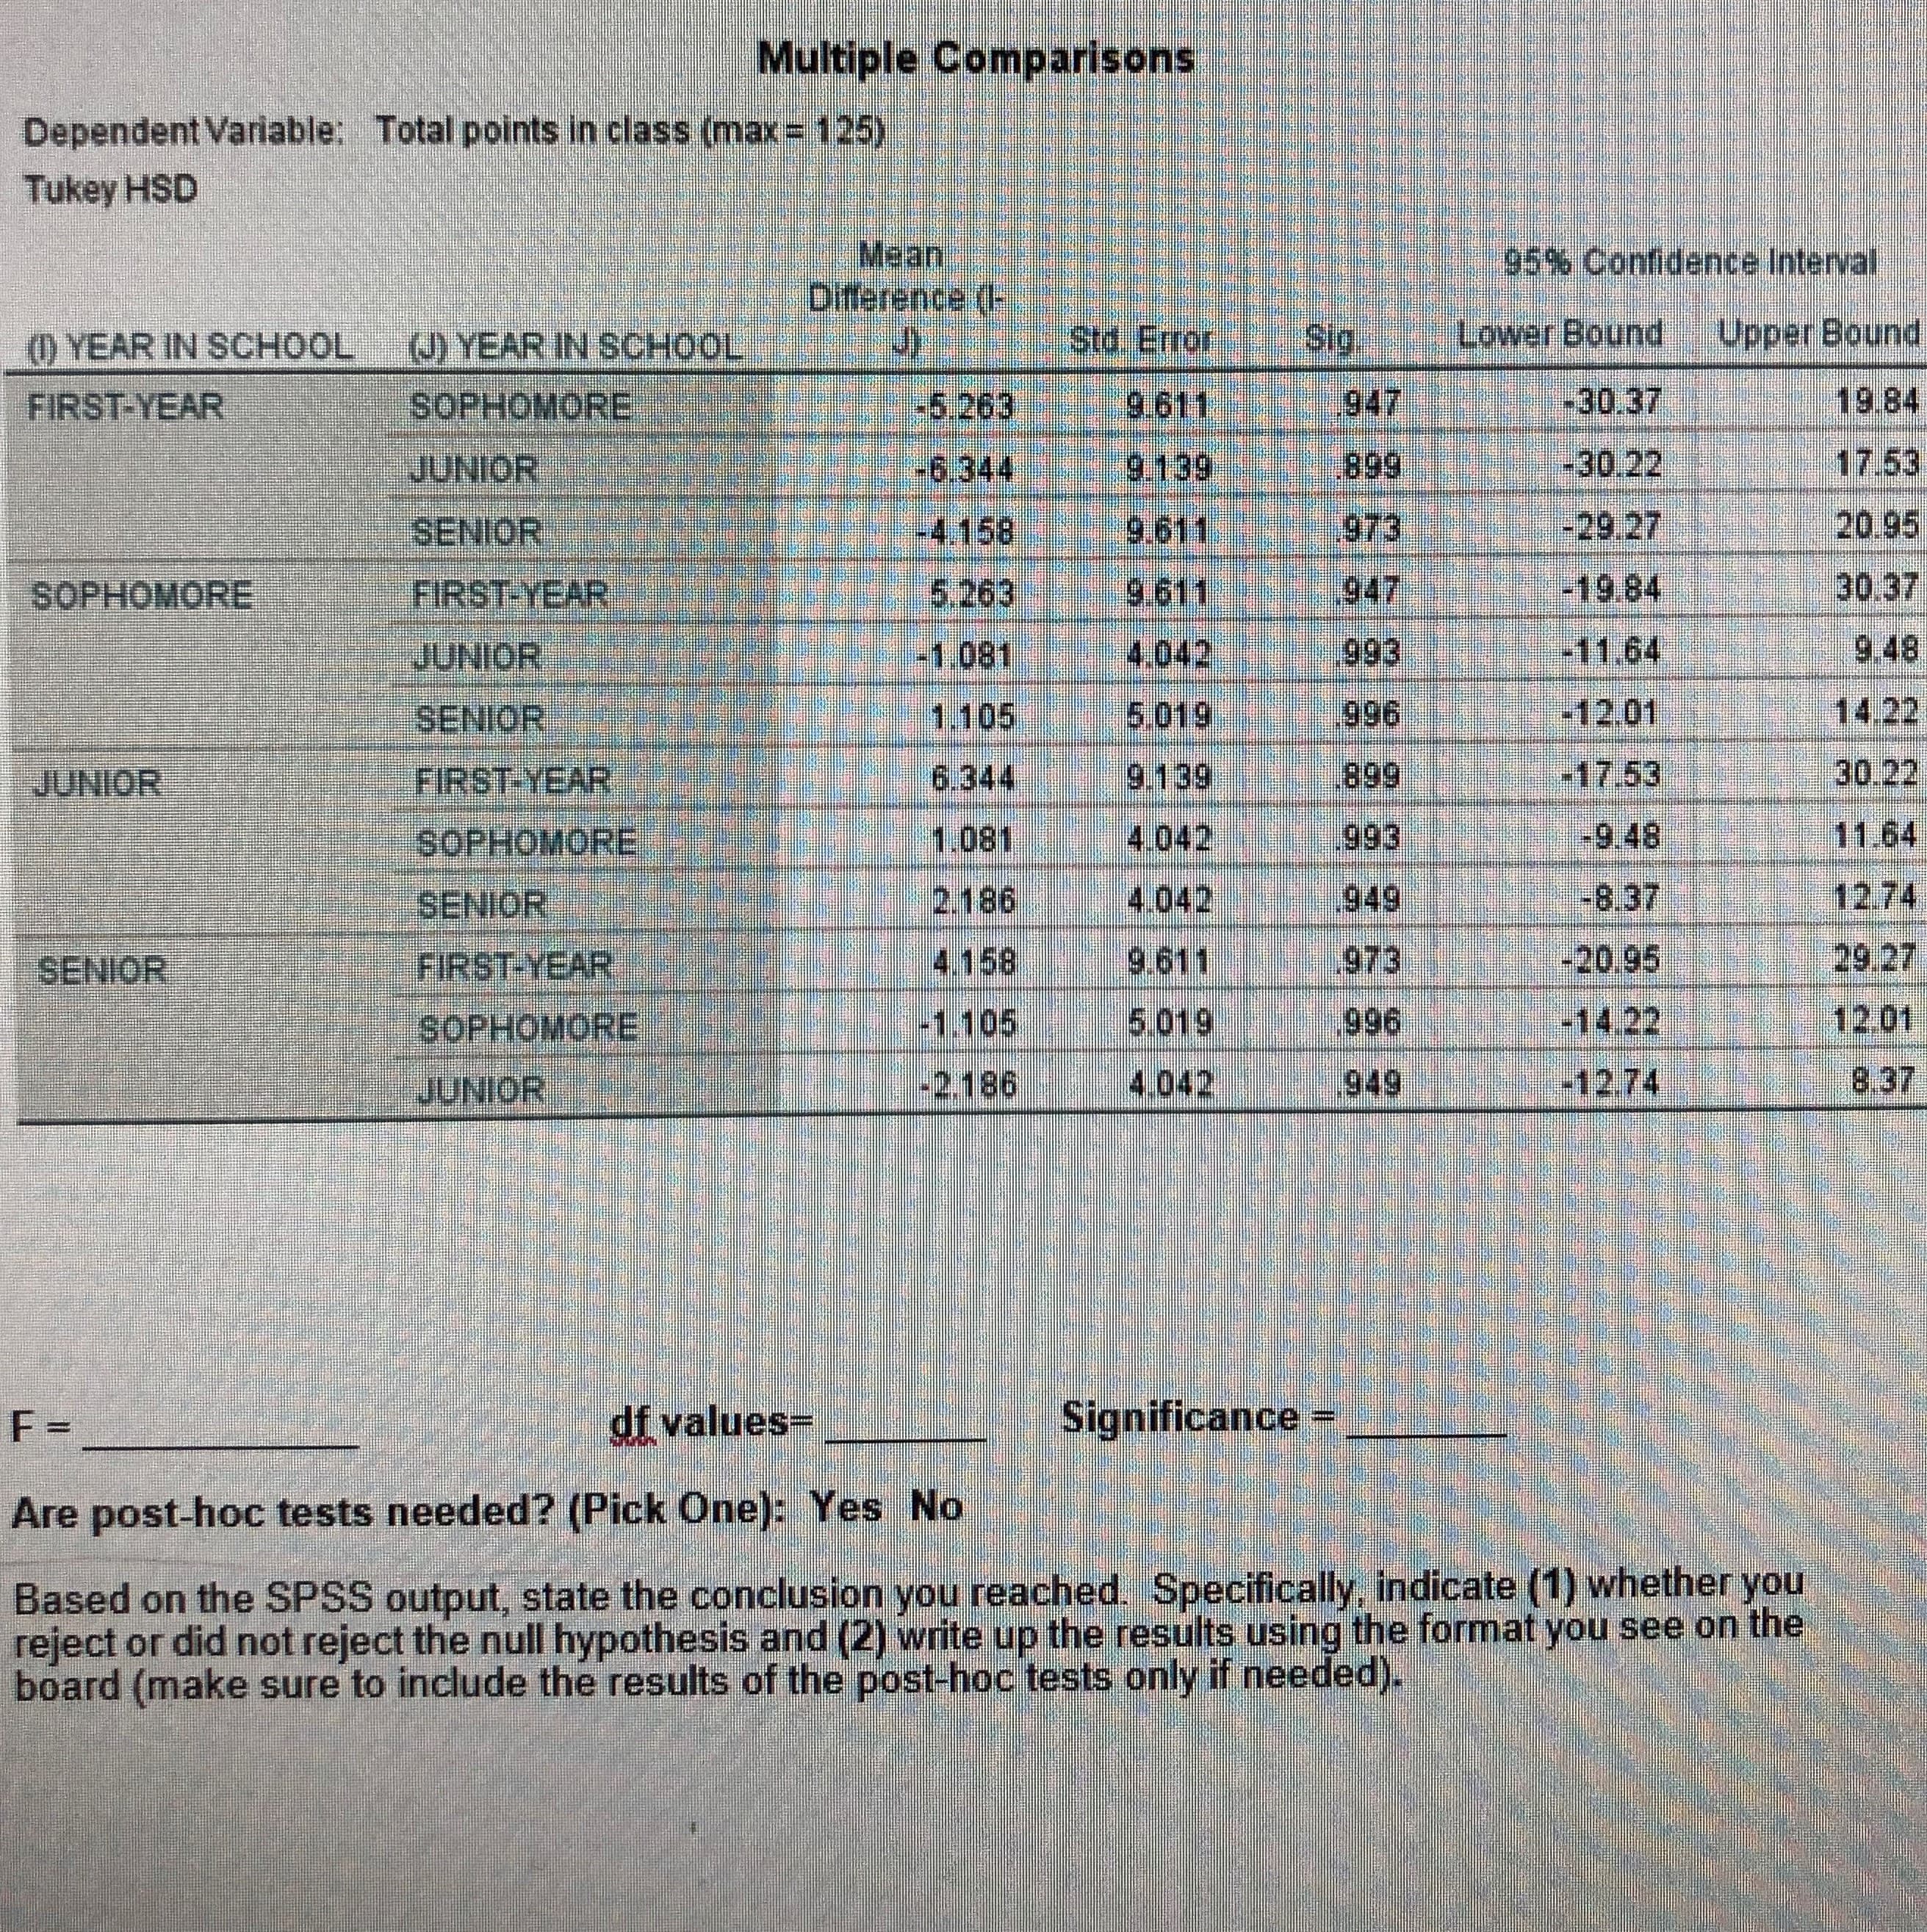
Transcribed Image Text:Multiple Comparisons
Total points in class (max= 125)
Dependent Variable:
Tukey HSD
Mean
Difference (-
95% Confidence Interval
Upper Bound
Lower Bound
Sig.
Std. Error
S YEAR IN SCHOOL
O YEAR IN SCHOOL
-30.37
19.84
947
SOPHOMORE
9.611
FIRST-YEAR
-5.263
17.53
-30.22
899
9.139
-6.344
-29.27
20.95
973
9.611
SENIOR
-4.158
30.37
-19.84
947
9.611
FIRST-YEAR
SOPHOMORE
5.263
9.48
-11.64
-1.081
4.042
JUNIOR
14.22
-12.01,
996
1.105
5.019
SENIOR
30.22
17,53
9.139
899
6.344
FIRST-YEAR
JUNIOR
-9.48
11.64
993
4.042
1.081
SOPHOMORE
12.74
-8.37
949
2.186
4.042
SENIOR
-20.95
973
9.611
4.158
FIRST-YEAR
SENIOR
12,01
996
-14.22
5.019
-1.105
SOPHOMORE
8.37
-12.74
949
-2,186
4.042
JUNIOR
Significance
df values=
Are post-hoc tests needed? (Pick One): Yes No
Based on the SPSS output, state the conclusion you reached. Specifically, indicate (1) whether you
reject or did not reject the null hypothesis and (2) write up the results using the format you see on the
board (make sure to include the results of the post-hoc tests only if needed).
Expert Solution
This question has been solved!
Explore an expertly crafted, step-by-step solution for a thorough understanding of key concepts.

This is a popular solution!

Trending now
This is a popular solution!

Step by step
Solved in 4 steps with 1 images

Recommended textbooks for you
Glencoe Algebra 1, Student Edition, 9780079039897…
Algebra
ISBN:
9780079039897
Author:
Carter
Publisher:
McGraw Hill

College Algebra (MindTap Course List)
Algebra
ISBN:
9781305652231
Author:
R. David Gustafson, Jeff Hughes
Publisher:
Cengage Learning
Glencoe Algebra 1, Student Edition, 9780079039897…
Algebra
ISBN:
9780079039897
Author:
Carter
Publisher:
McGraw Hill
College Algebra (MindTap Course List)
Algebra
ISBN:
9781305652231
Author:
R. David Gustafson, Jeff Hughes
Publisher:
Cengage Learning