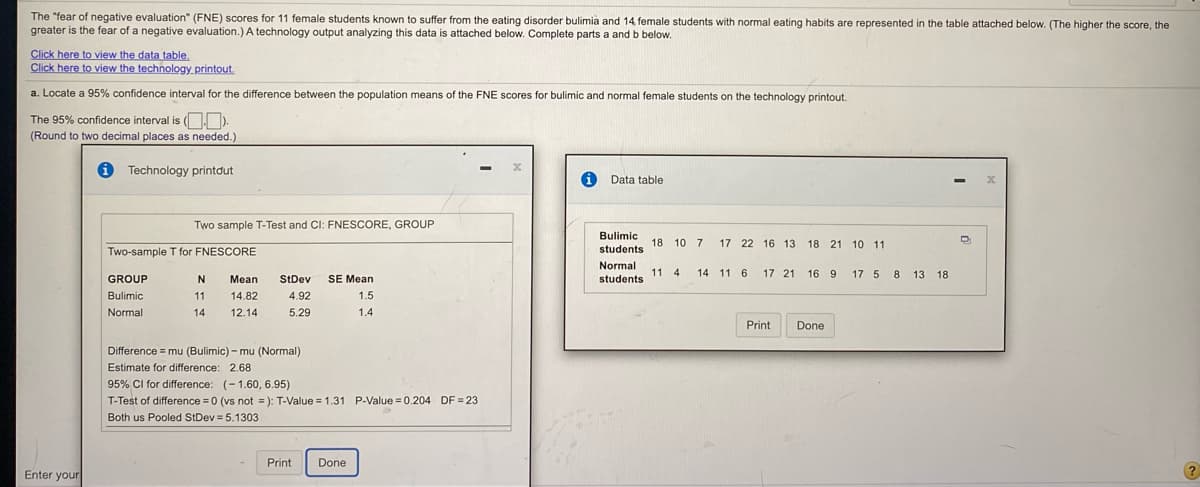
The "fear of negative evaluation" (FNE) scores for 11 female students known to suffer from the eating disorder bulimia and 14 female students with normal eating habits are represented in the table attached below. (The higher the score, the greater is the fear of a negative evaluation.) A technology output analyzing this data is attached below. Complete parts a and b below. Click here to view the data table. Click here to view the technology printout, a. Locate a 95% confidence interval for the difference between the population means of the FNE scores for bulimic and normal female students on the technology printout. The 95% confidence interval is (O). (Round to two decimal places as needed.) 1 Technology printout Data table Two sample T-Test and Cl: FNESCORE, GROUP Bulimic 18 10 7 17 22 16 13 18 21 10 11 Two-sample T for FNESCORE students Normal 11 4 14 11 6 17 21 16 9 17 5 8 13 18 GROUP N Mean StDev SE Mean students Bulimic 11 14.82 4.92 1.5 Normal 14 12.14 5.29 1.4 Print Done Difference = mu (Bulimic) - mu (Normal) Estimate for difference: 2.68 95% Cl for difference: (-1.60, 6.95) T-Test of difference = 0 (vs not = ): T-Value = 1.31 P-Value = 0.204 DF = 23 Both us Pooled StDev = 5.1303 Print Done Enter your


Inverse Normal Distribution
The method used for finding the corresponding z-critical value in a normal distribution using the known probability is said to be an inverse normal distribution. The inverse normal distribution is a continuous probability distribution with a family of two parameters.
Mean, Median, Mode
It is a descriptive summary of a data set. It can be defined by using some of the measures. The central tendencies do not provide information regarding individual data from the dataset. However, they give a summary of the data set. The central tendency or measure of central tendency is a central or typical value for a probability distribution.
Z-Scores
A z-score is a unit of measurement used in statistics to describe the position of a raw score in terms of its distance from the mean, measured with reference to standard deviation from the mean. Z-scores are useful in statistics because they allow comparison between two scores that belong to different normal distributions.


Trending now
This is a popular solution!

Step by step
Solved in 2 steps


