Is it reasonable to treat the following as a sample from an approximately normal population? Explain. can/cannot for blank parts
Is it reasonable to treat the following as a sample from an approximately normal population? Explain. can/cannot for blank parts

MATLAB: An Introduction with Applications
6th Edition
ISBN:9781119256830
Author:Amos Gilat
Publisher:Amos Gilat
Chapter1: Starting With Matlab
Section: Chapter Questions
Problem 1P

Related questions
Question
Is it reasonable to treat the following as a sample from an approximately normal population? Explain.
can/cannot for blank parts
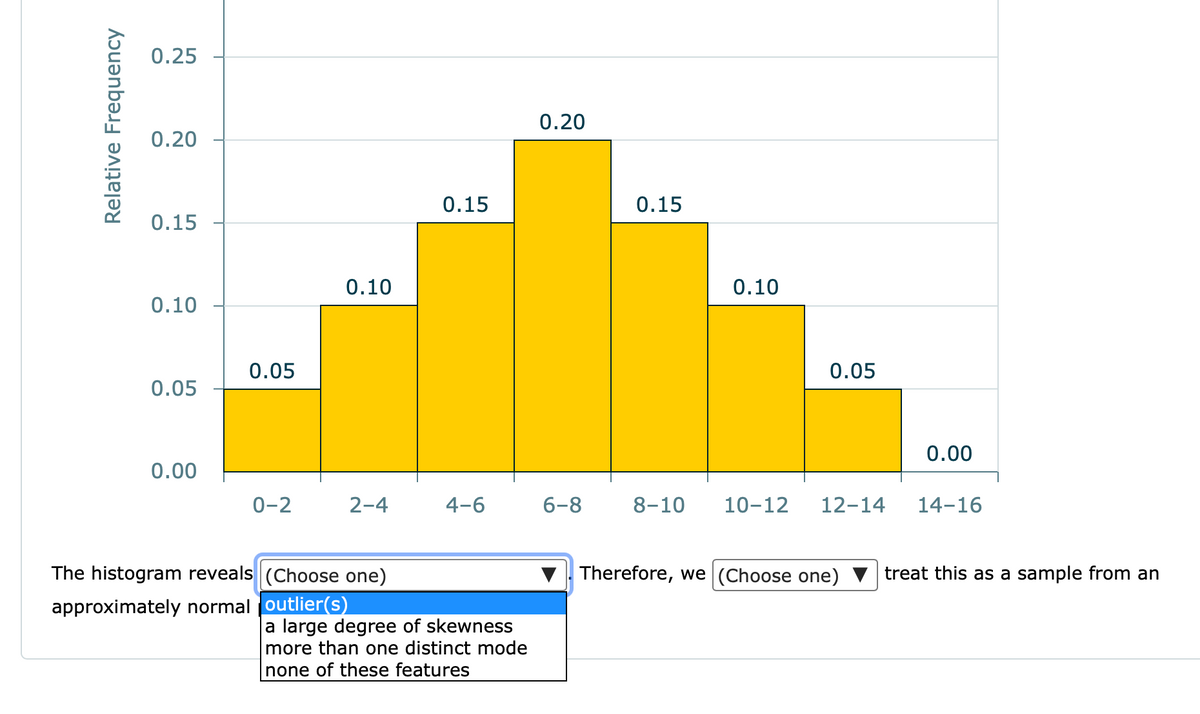
Transcribed Image Text:0.25
0.20
0.20
0.15
0.15
0.15
0.10
0.10
0.10
0.05
0.05
0.05
0.00
0.00
0-2
2-4
4-6
6-8
8-10
10-12
12-14
14-16
The histogram reveals (Choose one)
Therefore, we (Choose one)
treat this as a sample from an
approximately normal outlier(s)
a large degree of skewness
more than one distinct mode
none of these features
Relative Frequency
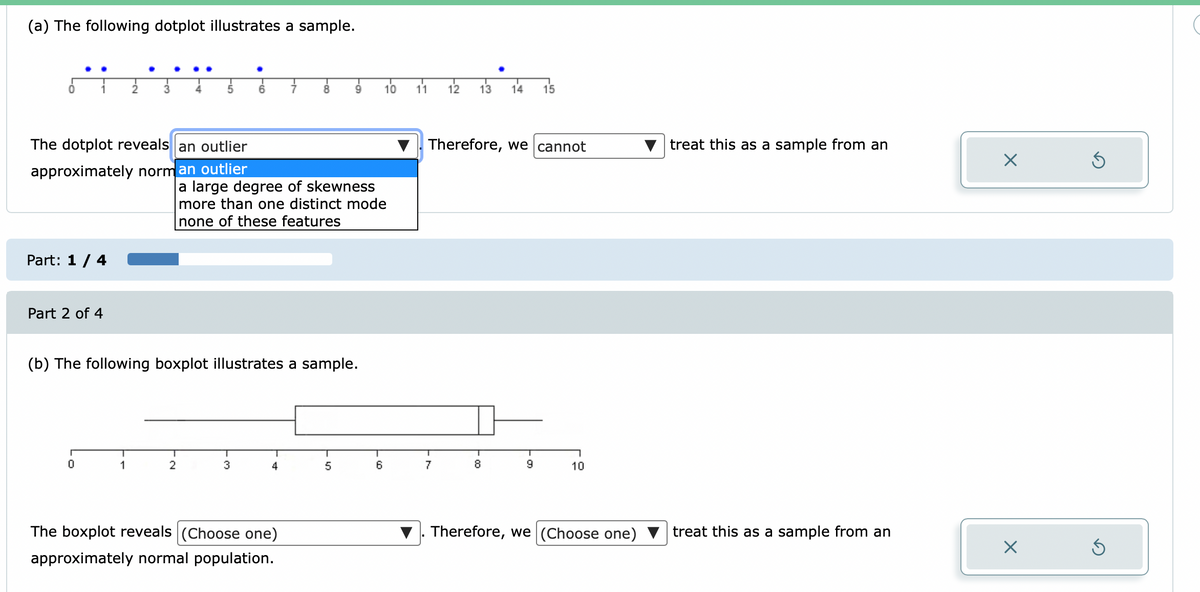
Transcribed Image Text:(a) The following dotplot illustrates a sample.
8.
9.
10 11 12
13
14
15
The dotplot reveals an outlier
Therefore, we cannot
treat this as a sample from an
approximately norm an outlier
a large degree of skewness
more than one distinct mode
none of these features
Part: 1 / 4
Part 2 of 4
(b) The following boxplot illustrates a sample.
1
2
3
4
6
7
8.
10
The boxplot reveals (Choose one)
Therefore, we (Choose one)
treat this as a sample from an
approximately normal population.
- 0o
• FO
Expert Solution
This question has been solved!
Explore an expertly crafted, step-by-step solution for a thorough understanding of key concepts.

This is a popular solution!

Trending now
This is a popular solution!

Step by step
Solved in 2 steps

Recommended textbooks for you
MATLAB: An Introduction with Applications
Statistics
ISBN:
9781119256830
Author:
Amos Gilat
Publisher:
John Wiley & Sons Inc

Probability and Statistics for Engineering and th…
Statistics
ISBN:
9781305251809
Author:
Jay L. Devore
Publisher:
Cengage Learning

Statistics for The Behavioral Sciences (MindTap C…
Statistics
ISBN:
9781305504912
Author:
Frederick J Gravetter, Larry B. Wallnau
Publisher:
Cengage Learning
MATLAB: An Introduction with Applications
Statistics
ISBN:
9781119256830
Author:
Amos Gilat
Publisher:
John Wiley & Sons Inc
Probability and Statistics for Engineering and th…
Statistics
ISBN:
9781305251809
Author:
Jay L. Devore
Publisher:
Cengage Learning
Statistics for The Behavioral Sciences (MindTap C…
Statistics
ISBN:
9781305504912
Author:
Frederick J Gravetter, Larry B. Wallnau
Publisher:
Cengage Learning

Elementary Statistics: Picturing the World (7th E…
Statistics
ISBN:
9780134683416
Author:
Ron Larson, Betsy Farber
Publisher:
PEARSON

The Basic Practice of Statistics
Statistics
ISBN:
9781319042578
Author:
David S. Moore, William I. Notz, Michael A. Fligner
Publisher:
W. H. Freeman

Introduction to the Practice of Statistics
Statistics
ISBN:
9781319013387
Author:
David S. Moore, George P. McCabe, Bruce A. Craig
Publisher:
W. H. Freeman