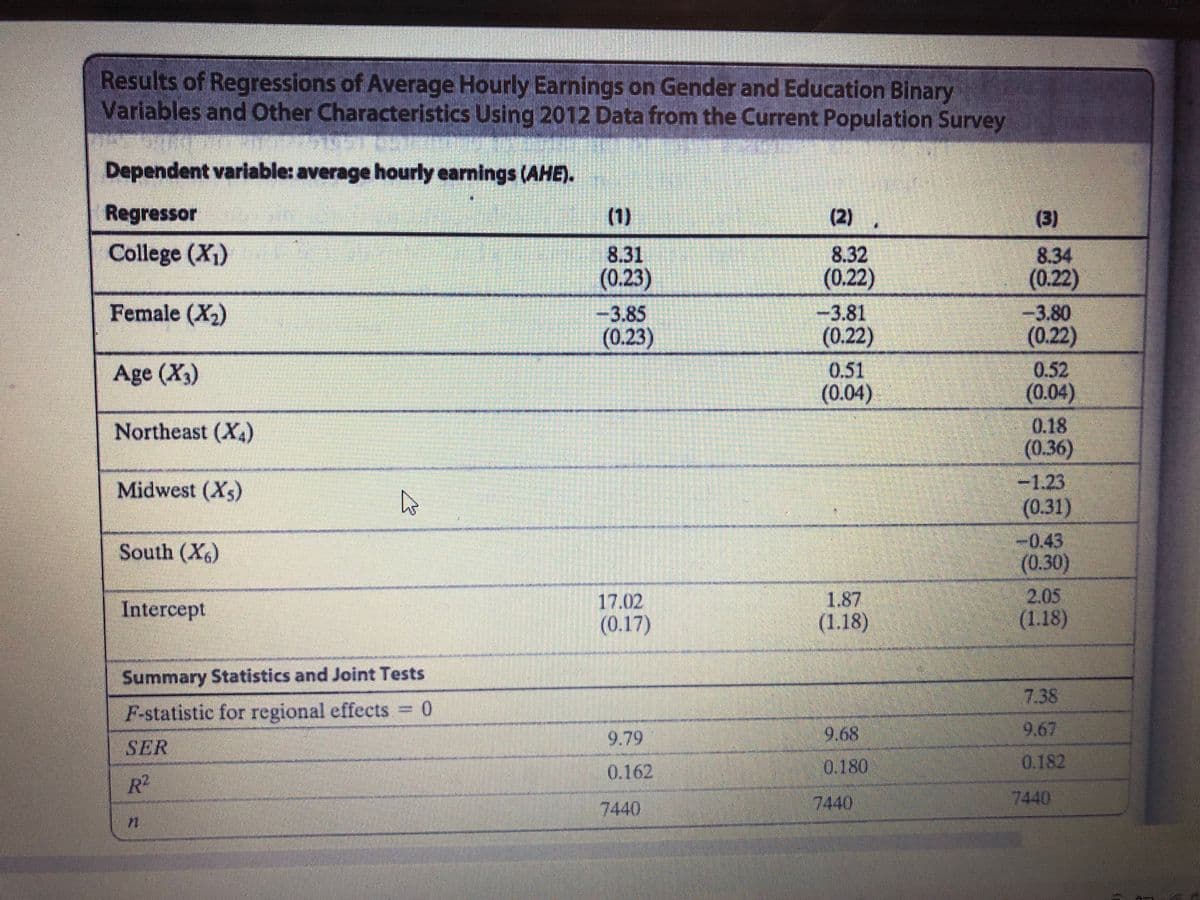
Is the male–female earnings difference estimated from this regression statistically significant at the 5% level? Construct a 95% confidence interval for the difference.


Q: Would you expect the F-ratio of an independent-samples ANOVA using the same data to be the same,…
A: Introduction: Repeated measures ANOVA or repeated measures analysis of variance is a parametric…
Q: What is the point estimate of the annual income of a salesperson with three years of college? Test…
A: In the problem, we are given a regression analysis output related to the data under study. Here, we…
Q: What percentage of the variability in the amout of fuel used can be explained by the variability in…
A: Given: Distance Amount of fuel used 20 2.14 25 2.75 30 2.65 35 3 28 2.8 40 2.479
Q: What is the conclusion about the t-statistic and the p-value?
A: Decision rule: If p-value ≤ α, then reject the null hypothesis. Otherwise, fail to reject the null…
Q: After you've found a significant ANOVA, you should do follow up comparisons to determine where the…
A: From the given information,
Q: What is the role of error term , ?? in regression analysis? What is the difference
A: *Answer :
Q: What two characteristics of an empirical distribution can DECREASE the size of the standard error?
A: The two characteristics of an empirical distribution that can decrease the size of the standard…
Q: Define how to use t-Statistic in Regression When the Sample Size Is Small? Explain Use of the…
A: The t statistics is divided by its standard error coefficient. The default error is an approximation…
Q: What is difference between chi and binomial statistics? When do we use regression analysis?
A: Hey there.! thank you for posting your question hope you're doing well.
Q: Describe the potential effects of outliers on performing statistical inference regarding the utility…
A: Effects of outliers in data:
Q: What is regression toward the mean, and how can it influence our interpretation of events?
A: Regression is a statistical measure, which measures the relationship between the means of dependent…
Q: Illustrate Confidence Interval for Pearson's Correlation?
A: Correlation coefficient: Correlation analysis is used to measure strength of the association between…
Q: The correlation between a response and an explanatory variable was calculated as part of a simple…
A: From the given data: Null and Alternate Hypothesis: H0: ρ=0HA: ρ≠0
Q: What is the acceptable range of skewness and kurtosis for normal distribution of data?
A:
Q: What is the expected average height of 8 year old boys, using the regression equation?
A: From the given information, the obtained regression equation is y=27.84+2.573x.
Q: How to calculate the standard error for multiple regression in order to get the 95% confidence…
A:
Q: What are the possible consequences of the presence of outliers in the data used for conducting a…
A: An outlier is an observation that is distant from the other values in a data set. It causes serious…
Q: What is the value of r square in the regression model? what is the additional contribution of…
A: Given that Step 1: From the given regression model
Q: When should you use a one-way ANOVA to analyze your data? Distinguish between one–way ANOVA for…
A: ANOVA compares one or more population mean scores with each other on the basis of the sample data;…
Q: A researcher conducted a research that majority of people who died during pandemic bought a new…
A: Given: Research that majority of people who died during pandemic
Q: how do i find quartile 1 in a set of data?
A: First quartile: The first quartile is the middle-most observation or median of the lower half of the…
Q: Is there a significant linear correlation between consumption and price? Use 0.05 level of…
A: Given: Consumption Price 0.386 1.35 0.474 1.5 0.393 1.39 0.425 1.49 0.406 1.36 0.344…
Q: Find the 30th and 98th percentile values of a normal variable with Mean of 12 and Variance of 3 (if…
A: Hello! As you have posted 2 different questions, we are answering the first question. In case you…
Q: ean when the results are marginally significant? What is the relationship between marginal…
A: Marginally significant results means when the p-value is a little greater than 0.05.
Q: What is the odds ratio for a study with a logistic regression coefficient -0.25254?
A: Odd ratio using logistic regression coefficient is given by Odd ratio= e(logistic regression…
Q: If I have a study where I am testing the relationship between abundances of zebras and gazelles,…
A: The given information is that the testing of the relationship for abundances of zebras and gazelles.
Q: Explain Hypothesis Tests and Confidence Intervals in Multiple Regression?
A: The hypothesis testing for a single coefficient in multiple regression is performed as: It is…
Q: sing the previous regression model, is there a statistically significant relationship between GPA…
A: The claim of the test is that, whether there is relationship between GPA and Salary Expectation or…
Q: What is the difference between the population and sample regression functions? Is this a distinction…
A: In this question, we have to tell difference between the population regression function and simple…
Q: How does having leather seats affect the expected price of the car, controlling for the mileage and…
A: Let us construct the regression equation by using the coefficient. price = 6953 - 0.0841*Mileage +…
Q: Why is finding the z-score called standardizing data? Does the Empirical Rule apply to the standard…
A: Given two problems related to standard normal distribution and emperical rule. We have to solve the…
Q: Explain how the variance inflation factor (VIF) affects the estimated standard deviation of a…
A: Variance inflation factor:Variance inflation factor of a variable is the ratio of the variance of…
Q: If a treatment is expected to decrease scores on a variable for which the mean is expecte
A: From the given information, If a treatment is expected to decrease scores on a variable. The mean is…
Q: How do you tell if a ANOVA is significant given the F value, p value, and eta squared? What does the…
A: In ANOVA, the null hypothesis is that there is no difference between group methods. If any group…
Q: Explain Regression with a Single Regressor, Hypothesis Tests and Confidence Intervals?
A:
Q: What is a confidence interval in statistics?
A: In inferential statistics, the two types of estimation are: point estimate and confidence interval…
Q: Critically discuss the relationship between the concepts of Regression and Analysis of Variance…
A: INTRODUCTION : Regression: If there are two or more variables in terms of the original units of…
Q: What does a statistically significant t test indicates?
A: Statistical significance: In the study, when the result obtained is very unlikely to occur just by…
Q: When you have significant results in data analysis, it is not necessary to report all relevant means…
A: Statistical significance is the likelihood that the difference in conversion rates between a given…
Q: What is the odds ratio for a study with a logistic regression coefficient -0.2524?
A: As given, the logistic regression coefficient is -0.2524. It is asked to find the odds ratio.
Q: A guidance counselor wants to determine if there is a relationship between a student's number of…
A: The scatter plot is used to observe the relation in between variables. It consists of data points.…
Q: Suppose that there is a high degree of correlation (but not perfect) between education, age, and…
A: In regression analysis, the problem of multicollinearity arises when one independent variable is…
Q: What is the explanation for the normality test?
A: Here we explain normality test.
Q: True or False: In order to perform an analysis of variance (ANOVA), the response variable must be…
A: Analysis of variance (ANOVA) is given.
Q: Explain how a restricted region of values of the predictor variables can affect our understanding of…
A: Restricted values of predictor variable:In a dataset, the available values of the predictor variable…
Q: rtising negatively related with sales? Are both Unemployment and Adver
A: linear regression model: sales=β0-0.6879β1+0.0266β2
Q: The most widely used measure of variability for a continuous variable is called the standard…
A:
. Is the male–female earnings difference estimated from this regression
statistically significant at the 5% level? Construct a 95% confidence
interval for the difference.


Trending now
This is a popular solution!

Step by step
Solved in 2 steps

- What is regression analysis? Describe the process of performing regression analysis on a graphing utility.study was conducted on 64 female college athletes. The researcher collected data on a number of variables including percent body fat, total body weight, lean body mass, and age of athlete. The researcher wondered if total body weight (TBW), lean body mass (LBM), and/or age are significant predictors of % body fat. All conditions have been checked and are met and no transformations were needed. The partial technology output from the multiple regression analysis is given below. What percent of the total variation in % body fat is explained by the regression model with total body weight, lean body mass, and age as explanatory variables?1. Explain the purpose or use of the following:a. Linear regression equationb. Correlation coefficient.
- Motorcycle Safety: As part of a study on motorcycle safety, the Texas Department of Motor Vehicles (DMV) collected data on the number of serious motorcycle accidents per 1000 licenses and the percentage of licensed drivers under the age of 25 in a sample of 42 counties. Data was collected over a one-year period follow and is contained in the attached data file named Motorcycles. Prepare a report that addresses the following: a. Develop numerical and graphical summaries of the data. b. Use regression analysis to investigate the relationship between the number of serious motorcycle accidents and the percentage of drivers under the age of 25. Discuss your findings. c. What conclusion and recommendations can you derive from your analysis?Multiple regression is sometimes used in litigation. In the case of Cargill, Inc. v. Hardin (1971), the prosecution charged that the cash price of wheat was manipulated in violation of the Commodity Exchange Act. In a statistical study conducted for this case, a multiple regression model was constructed to predict the cash price of wheat using three supply-and-demand explanatory variables: economic growth, population growth, and meat consumption. Data for 24 years were used to construct the regression equation, and a prediction for the suspect period was computed from this equation. Which of the independent variables is the most significant predictor of the cash price of wheat? a. Intercept b. Economic Growth c. Population Growth d. Meat ConsumptionMultiple regression is sometimes used in litigation. In the case of Cargill, Inc. v. Hardin (1971), the prosecution charged that the cash price of wheat was manipulated in violation of the Commodity Exchange Act. In a statistical study conducted for this case, a multiple regression model was constructed to predict the cash price of wheat using three supply-and-demand explanatory variables: economic growth, population growth, and meat consumption. Data for 24 years were used to construct the regression equation, and a prediction for the suspect period was computed from this equation Based on a significance level of 5%, which of the following independent variables significantly predict the cash price of wheat? a. Economic Growth b. Population Growth c. Meat Consumption d. All the independent variables significantly predict the cash price of wheat.
- Multiple regression is sometimes used in litigation. In the case of Cargill, Inc. v. Hardin (1971), the prosecution charged that the cash price of wheat was manipulated in violation of the Commodity Exchange Act. In a statistical study conducted for this case, a multiple regression model was constructed to predict the cash price of wheat using three supply-and-demand explanatory variables: economic growth, population growth, and meat consumption. Data for 24 years were used to construct the regression equation, and a prediction for the suspect period was computed from this equation. The actual cash price of wheat under investigation in 1963 was $2.13. Based on the comparison of the correct predicted cash price calculated in the previous question and the actual cash price, what does the evidence suggest about Cargill, Inc.? a. Because the predicted price is relatively close to the actual price (within one cent), Cargill, Inc. probably did not artificially manipulate the price of wheat.…Multiple regression is sometimes used in litigation. In the case of Cargill, Inc. v. Hardin (1971), the prosecution charged that the cash price of wheat was manipulated in violation of the Commodity Exchange Act. In a statistical study conducted for this case, a multiple regression model was constructed to predict the cash price of wheat using three supply-and-demand explanatory variables: economic growth, population growth, and meat consumption. Data for 24 years were used to construct the regression equation, and a prediction for the suspect period was computed from this equation. In 1963, during the period in question, economic growth was 3.8; population growth was 1.40; and meat consumption was 152.95. Based on these values, what would be the predicted cash price of wheat at this time in 1963?Multiple regression is sometimes used in litigation. In the case of Cargill, Inc. v. Hardin (1971), the prosecution charged that the cash price of wheat was manipulated in violation of the Commodity Exchange Act. In a statistical study conducted for this case, a multiple regression model was constructed to predict the cash price of wheat using three supply-and-demand explanatory variables: economic growth, population growth, and meat consumption. Data for 24 years were used to construct the regression equation, and a prediction for the suspect period was computed from this equation. The following output represents the regression analysis. . Before the judge and jury consider the results of the regression model, they must ensure that the model is valid. What is the proper hypothesis test for this model, and what is the proper conclusion?
- Acrylamide is a chemical that is sometimes found in cooked starchy foods and which is thought to increase the risk of certain kinds of cancer. The paper "A Statistical Regression Model for the Estimation of Acrylamide Concentrations in French Fries for Excess Lifetime Cancer Risk Assessment"† describes a study to investigate the effect of x = frying time (in seconds) and y = acrylamide concentration (in micrograms per kg) in french fries. The data in the accompanying table are approximate values read from a graph that appeared in the paper. FryingTime AcrylamideConcentration 150 155 240 120 240 195 270 185 300 145 300 270 (a) Construct a scatterplot of these data. A scatterplot has 6 points. The horizontal axis is labeled "x" and ranges from 100 to 350. The vertical axis is labeled "y" and ranges from 50 to 350. The points are plotted from left to right in a downward, diagonal direction starting from the upper left of the diagram. Along the horizontal axis,…Acrylamide is a chemical that is sometimes found in cooked starchy foods and which is thought to increase the risk of certain kinds of cancer. The paper "A Statistical Regression Model for the Estimation of Acrylamide Concentrations in French Fries for Excess Lifetime Cancer Risk Assessment"† describes a study to investigate the effect of x = frying time (in seconds) and y = acrylamide concentration (in micrograms per kg) in French fries. The data in the accompanying table are approximate values read from a graph that appeared in the paper. FryingTime AcrylamideConcentration 150 155 240 115 240 190 270 180 300 140 300 265 (a) Construct a scatterplot of these data. A scatterplot has 6 points.The horizontal axis is labeled "x" and ranges from 100 to 350.The vertical axis is labeled "y" and ranges from 50 to 350.The points are plotted from left to right in a horizontal direction starting from the lower left side of the diagram.Along the horizontal axis, there is 1 point at 150, 2 points…Acrylamide is a chemical that is sometimes found in cooked starchy foods and which is thought to increase the risk of certain kinds of cancer. The paper "A Statistical Regression Model for the Estimation of Acrylamide Concentrations in French Fries for Excess Lifetime Cancer Risk Assessment"† describes a study to investigate the effect of x = frying time (in seconds) and y = acrylamide concentration (in micrograms per kg) in french fries. The data in the accompanying table are approximate values read from a graph that appeared in the paper. Frying Time Acrylamide Concentration 150 155 240 120 240 195 270 185 300 145 300 270 (a) Construct a scatterplot of these data. A scatterplot has 6 points. The horizontal axis is labeled "x" and ranges from 100 to 350. The vertical axis is labeled "y" and ranges from 50 to 350. The points are plotted from left to right in a downward, diagonal direction starting from the upper left of the diagram. Along the horizontal axis, there are 2 points at…
