Is there a significant difference among the scores of the different groups? Group 1 Group 2 Group 3 Group 4 Group 5 Group 6 1 30 25 18 24 30 34 2 36 30 17 26 22 30 3 33 26 10 26 20 31 4 39 26 14 25 21 30 5 34 27 17 18 28 32 6 36 27 17 17 24 32 7 35 27 19 20 26 30 8 38 28 10 23 27 31 9 37 25 10 16 25 32 10 30 25 18 24 30 34 11 36 27 17 17 24 32
Is there a significant difference among the scores of the different groups? Group 1 Group 2 Group 3 Group 4 Group 5 Group 6 1 30 25 18 24 30 34 2 36 30 17 26 22 30 3 33 26 10 26 20 31 4 39 26 14 25 21 30 5 34 27 17 18 28 32 6 36 27 17 17 24 32 7 35 27 19 20 26 30 8 38 28 10 23 27 31 9 37 25 10 16 25 32 10 30 25 18 24 30 34 11 36 27 17 17 24 32

MATLAB: An Introduction with Applications
6th Edition
ISBN:9781119256830
Author:Amos Gilat
Publisher:Amos Gilat
Chapter1: Starting With Matlab
Section: Chapter Questions
Problem 1P

Related questions
Question
Is there a significant difference among the scores of the different groups?
| Group 1 | Group 2 | Group 3 | Group 4 | Group 5 | Group 6 | |
| 1 | 30 | 25 | 18 | 24 | 30 | 34 |
| 2 | 36 | 30 | 17 | 26 | 22 | 30 |
| 3 | 33 | 26 | 10 | 26 | 20 | 31 |
| 4 | 39 | 26 | 14 | 25 | 21 | 30 |
| 5 | 34 | 27 | 17 | 18 | 28 | 32 |
| 6 | 36 | 27 | 17 | 17 | 24 | 32 |
| 7 | 35 | 27 | 19 | 20 | 26 | 30 |
| 8 | 38 | 28 | 10 | 23 | 27 | 31 |
| 9 | 37 | 25 | 10 | 16 | 25 | 32 |
| 10 | 30 | 25 | 18 | 24 | 30 | 34 |
| 11 | 36 | 27 | 17 | 17 | 24 | 32 |
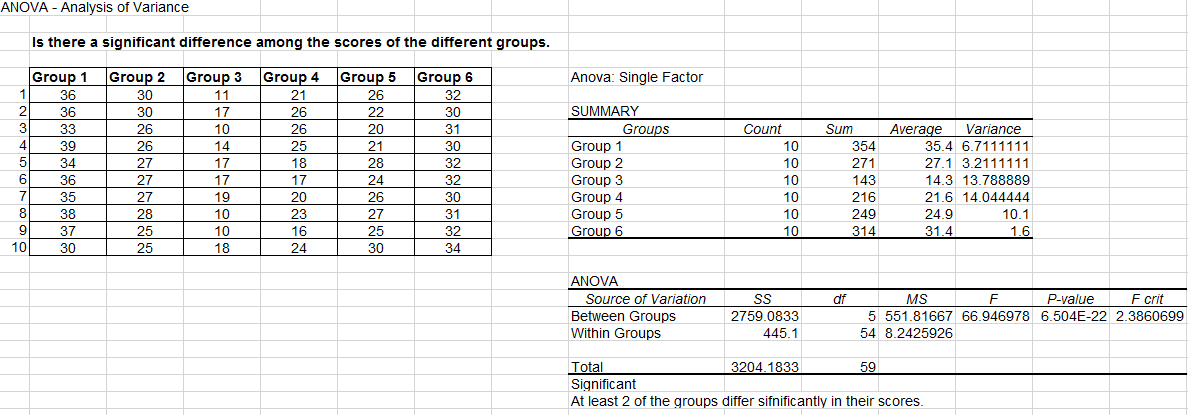
Transcribed Image Text:ANOVA - Analysis of Variance
Is there a significant difference among the scores of the different groups.
Group 1
Group 2
Group 3
Group 4
Group 5 Group 6
Anova: Single Factor
1
36
30
11
21
26
32
36
30
17
26
22
30
SUMMARY
3
33
26
10
26
20
31
Groups
Count
Sum
Average
Variance
4
39
26
14
25
21
30
Group 1
10
354
35.4 6.7111111
5
34
Group 2
Group 3
27
17
18
28
32
10
271
27.1 3.2111111
36
27
17
17
24
32
10
143
14.3 13.788889
7
Group 4
Group 5
Group 6
35
27
19
20
26
30
10
216
21.6 14.044444
8.
38
28
10
23
27
31
10
249
24.9
10.1
37
25
10
16
25
32
10
314
31.4
1.6
10
30
25
18
24
30
34
ANOVA
Source of Variation
df
MS
F
P-value
F crit
Between Groups
2759.0833
5 551.81667 66.946978 6.504E-22 2.3860699
Within Groups
445.1
54 8.2425926
Total
Significant
At least 2 of the groups differ sifnificantly in their scores.
3204.1833
59
Expert Solution
This question has been solved!
Explore an expertly crafted, step-by-step solution for a thorough understanding of key concepts.

Step by step
Solved in 4 steps

Recommended textbooks for you
MATLAB: An Introduction with Applications
Statistics
ISBN:
9781119256830
Author:
Amos Gilat
Publisher:
John Wiley & Sons Inc

Probability and Statistics for Engineering and th…
Statistics
ISBN:
9781305251809
Author:
Jay L. Devore
Publisher:
Cengage Learning

Statistics for The Behavioral Sciences (MindTap C…
Statistics
ISBN:
9781305504912
Author:
Frederick J Gravetter, Larry B. Wallnau
Publisher:
Cengage Learning
MATLAB: An Introduction with Applications
Statistics
ISBN:
9781119256830
Author:
Amos Gilat
Publisher:
John Wiley & Sons Inc
Probability and Statistics for Engineering and th…
Statistics
ISBN:
9781305251809
Author:
Jay L. Devore
Publisher:
Cengage Learning
Statistics for The Behavioral Sciences (MindTap C…
Statistics
ISBN:
9781305504912
Author:
Frederick J Gravetter, Larry B. Wallnau
Publisher:
Cengage Learning

Elementary Statistics: Picturing the World (7th E…
Statistics
ISBN:
9780134683416
Author:
Ron Larson, Betsy Farber
Publisher:
PEARSON

The Basic Practice of Statistics
Statistics
ISBN:
9781319042578
Author:
David S. Moore, William I. Notz, Michael A. Fligner
Publisher:
W. H. Freeman

Introduction to the Practice of Statistics
Statistics
ISBN:
9781319013387
Author:
David S. Moore, George P. McCabe, Bruce A. Craig
Publisher:
W. H. Freeman