It seems these days that students have to work more and more each week to be able to afford the costs of college. For a recent labor survey conducted by the government, there were 79 respondents who were working while attending college. The frequency distribution below summarizes the number of hours worked per week as reported by the respondents. Number of hours worked per week Frequency (hours per week) 26 to 30 6. 31 to 35 24 36 to 40 19 41 to 45 13 46 to 50 9.
It seems these days that students have to work more and more each week to be able to afford the costs of college. For a recent labor survey conducted by the government, there were 79 respondents who were working while attending college. The frequency distribution below summarizes the number of hours worked per week as reported by the respondents. Number of hours worked per week Frequency (hours per week) 26 to 30 6. 31 to 35 24 36 to 40 19 41 to 45 13 46 to 50 9.

Glencoe Algebra 1, Student Edition, 9780079039897, 0079039898, 2018
18th Edition
ISBN:9780079039897
Author:Carter
Publisher:Carter
Chapter10: Statistics
Section10.5: Comparing Sets Of Data
Problem 13PPS

Related questions
Question
100%
Based on frequency distribution use four or more decimal places round answer to one decimal place
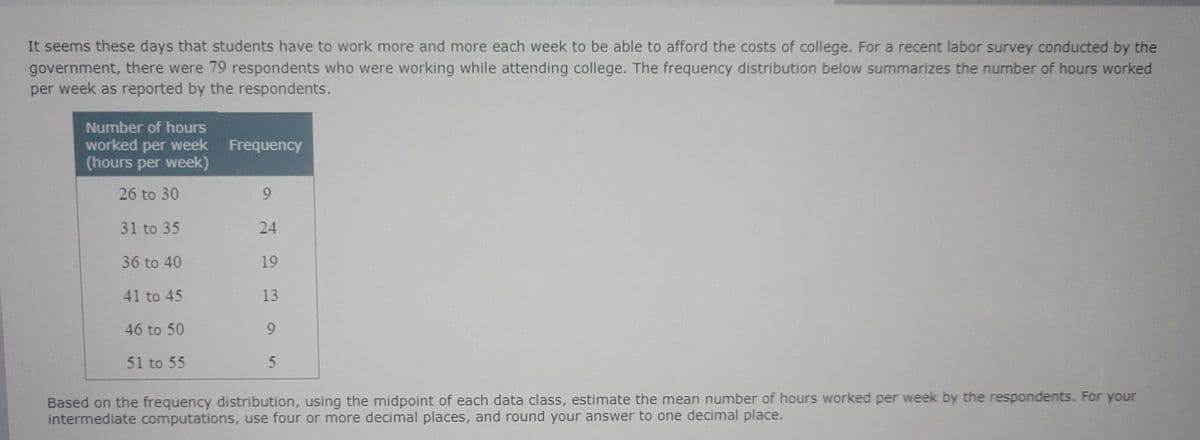
Transcribed Image Text:It seems these days that students have to work more and more each week to be able to afford the costs of college. For a recent labor survey conducted by the
government, there were 79 respondents who were working while attending college. The frequency distribution below summarizes the number of hours worked
per week as reported by the respondents.
Number of hours
worked per week
(hours per week)
Frequency
26 to 30
9.
31 to 35
24
36 to 40
19
41 to 45
13
46 to 50
9.
51 to 55
Based on the frequency distribution, using the midpoint of each data class, estimate the mean number of hours worked per week by the respondents. For your
intermediate computations, use four or more decimal places, and round your answer to one decimal place.
Expert Solution
This question has been solved!
Explore an expertly crafted, step-by-step solution for a thorough understanding of key concepts.

This is a popular solution!

Trending now
This is a popular solution!

Step by step
Solved in 2 steps

Recommended textbooks for you
Glencoe Algebra 1, Student Edition, 9780079039897…
Algebra
ISBN:
9780079039897
Author:
Carter
Publisher:
McGraw Hill
Glencoe Algebra 1, Student Edition, 9780079039897…
Algebra
ISBN:
9780079039897
Author:
Carter
Publisher:
McGraw Hill