It seems these days that students have to work more and more each week to be able to afford the costs of college. For a recent labor survey conducted by the government, there were 76 respondents who were working while attending college. The frequency distribution below summarizes the number of hours worked per week as reported by the respondents. Number of hours worked per week (hours per week) Frequency 26 to 30 31 to 35 25 36 to 40 20 41 to 45 12 46 to 50 8. 51 to 55 3 Based on the frequency distribution, using the midpoint of each data class, estimate the mean number of hours worked per week by the respondents. For your intermediate computations, use four or more decimal places, and round your answer to one decimal place. l hours per week
It seems these days that students have to work more and more each week to be able to afford the costs of college. For a recent labor survey conducted by the government, there were 76 respondents who were working while attending college. The frequency distribution below summarizes the number of hours worked per week as reported by the respondents. Number of hours worked per week (hours per week) Frequency 26 to 30 31 to 35 25 36 to 40 20 41 to 45 12 46 to 50 8. 51 to 55 3 Based on the frequency distribution, using the midpoint of each data class, estimate the mean number of hours worked per week by the respondents. For your intermediate computations, use four or more decimal places, and round your answer to one decimal place. l hours per week

Glencoe Algebra 1, Student Edition, 9780079039897, 0079039898, 2018
18th Edition
ISBN:9780079039897
Author:Carter
Publisher:Carter
Chapter10: Statistics
Section: Chapter Questions
Problem 27SGR

Related questions
Question
Transcribed Image Text:Espa
24
25
26
27
28
29
30
31
= 33
34
= 35
=36
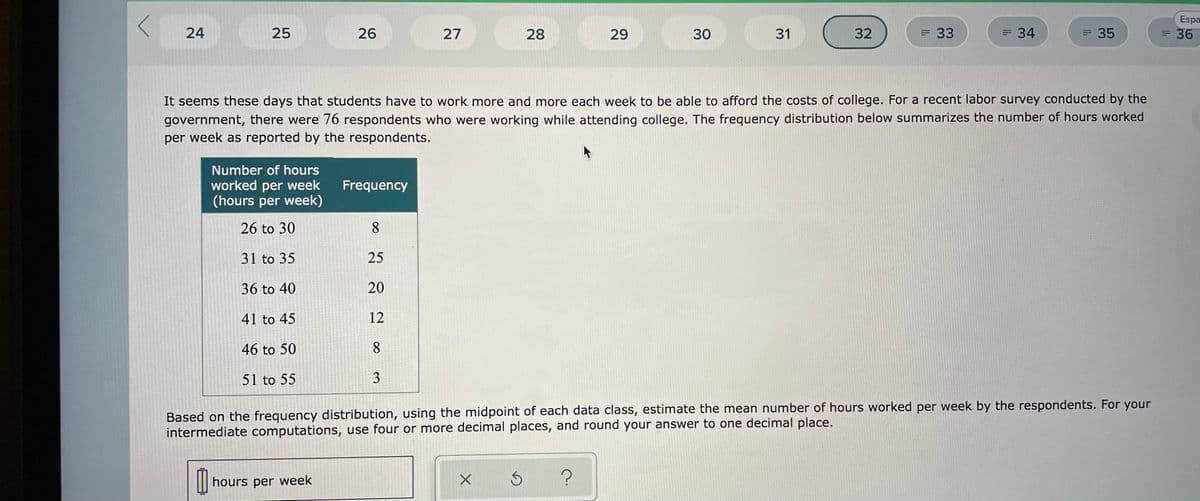
It seems these days that students have to work more and more each week to be able to afford the costs of college. For a recent labor survey conducted by the
government, there were 76 respondents who were working while attending college. The frequency distribution below summarizes the number of hours worked
per week as reported by the respondents.
Number of hours
worked per week
(hours per week)
Frequency
26 to 30
8.
31 to 35
25
36 to 40
20
41 to 45
12
46 to 50
8.
51 to 55
3
Based on the frequency distribution, using the midpoint of each data class, estimate the mean number of hours worked per week by the respondents. For your
intermediate computations, use four or more decimal places, and round your answer to one decimal place.
hours per week
32
Expert Solution
This question has been solved!
Explore an expertly crafted, step-by-step solution for a thorough understanding of key concepts.

This is a popular solution!

Trending now
This is a popular solution!

Step by step
Solved in 2 steps

Recommended textbooks for you
Glencoe Algebra 1, Student Edition, 9780079039897…
Algebra
ISBN:
9780079039897
Author:
Carter
Publisher:
McGraw Hill

Holt Mcdougal Larson Pre-algebra: Student Edition…
Algebra
ISBN:
9780547587776
Author:
HOLT MCDOUGAL
Publisher:
HOLT MCDOUGAL
Glencoe Algebra 1, Student Edition, 9780079039897…
Algebra
ISBN:
9780079039897
Author:
Carter
Publisher:
McGraw Hill
Holt Mcdougal Larson Pre-algebra: Student Edition…
Algebra
ISBN:
9780547587776
Author:
HOLT MCDOUGAL
Publisher:
HOLT MCDOUGAL