IV. Conclusion: Based on your findings on ratio analysis and interpretation, what conclusion can you make? V. Recommendations: - What recommendations can you give to the company with regards to your findings? - What recommendations can you give to the investor with regards to your findings?
IV. Conclusion: Based on your findings on ratio analysis and interpretation, what conclusion can you make? V. Recommendations: - What recommendations can you give to the company with regards to your findings? - What recommendations can you give to the investor with regards to your findings?
Chapter5: Evaluating Operating And Financial Performance
Section: Chapter Questions
Problem 2EP
Related questions
Question
IV. Conclusion:
Based on your findings on ratio analysis and interpretation, what conclusion can you make?
V. Recommendations:
- What recommendations can you give to the company with regards to your findings?
- What recommendations can you give to the investor with regards to your findings?

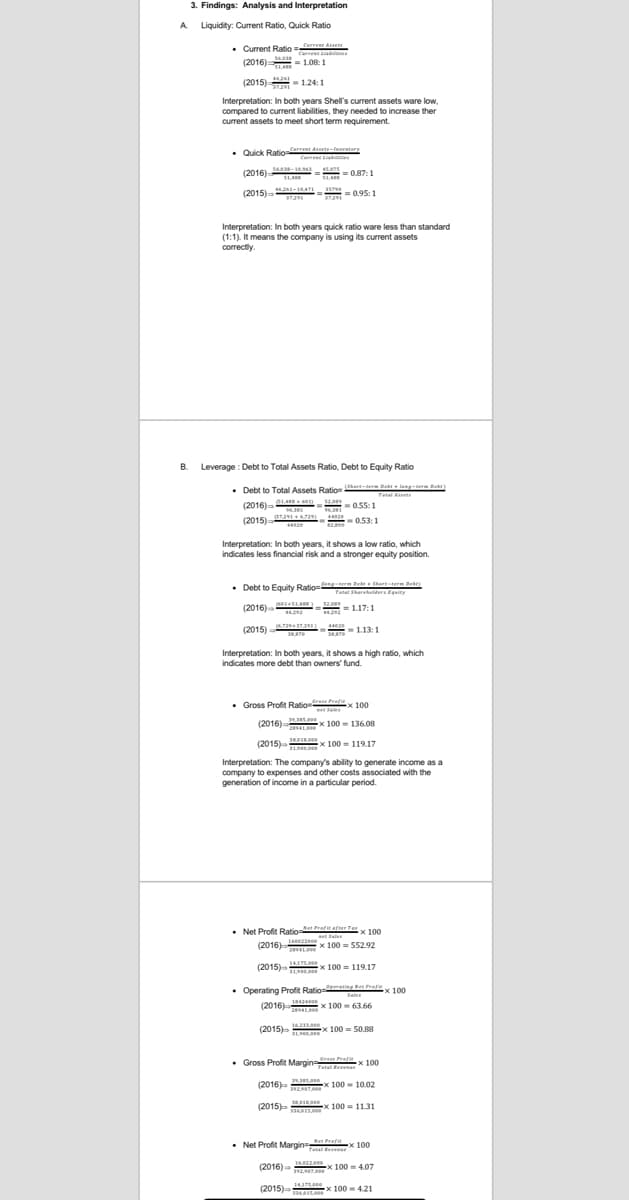
Transcribed Image Text:(2016) S)
3. Findings: Analysis and Interpretation
A Liquidity: Current Ratio, Quick Ratio
• Current Ratio = te
Curre ne
(2016)
- 1.08:1
(2015)=
Interpretation: In both years Shell's current assets ware lw,
compared to current liabilities, they needed to increase ther
current assets to meet short term requirement.
• Quick Ratio
Carrent dt-luter
Currend Lianies
(2016) - 0.87:1
S1.4
(2015)
= 0.95:1
Interpretation: In both years quick ratio ware less than standard
(1:1). It means the company is using its current assets
correctly
B.
Leverage : Debt to Total Assets Ratio, Debt to Equity Ratio
hart-term Det + lang-t be)
• Debt to Total Assets Ration
(2016)
Tetal A
a
- =0.55:1
(2015)-
- 0.53:1
Interpretation: In both years, it shows a low ratio, which
indicates less financial risk and a stronger equity position.
• Debt to Equity Rationngterm e shertterm Bee
Faal Sharehaldere Eqity
(2016)
= 1.17:1
(2015)
.72
-1.13:1
Interpretation: In both years, it shows a high ratio, which
indicates more debt than owners' fund.
• Gross Profit Ratio tratia 100
(2016) Ax
100 - 136.08
(2015) x 100 - 119.17
Interpretation: The company's ability to generate income as a
company to expenses and other costs associated with the
generation of income in a particular period.
• Net Profit Ratio-rafitafterTer x 100
Sales
(2016) x 100 = S52.92
(2015) x 100 = 119.17
175.00
• Operating Profit Ratio n atx 100
Sale
(2016)
x 100 - 63.66
(2015)-
16.231e
x 100 = 50.88
Sres Profe
Gross Profit Margin
Tetal Revene
(2016) x 100 - 10.02
(2015) x 100 - 1131
• Net Profit Margin
n Profit
Tet x 100
(2016)
ZAx 100 - 4.07
32,
(2015) x 100 - 4.21

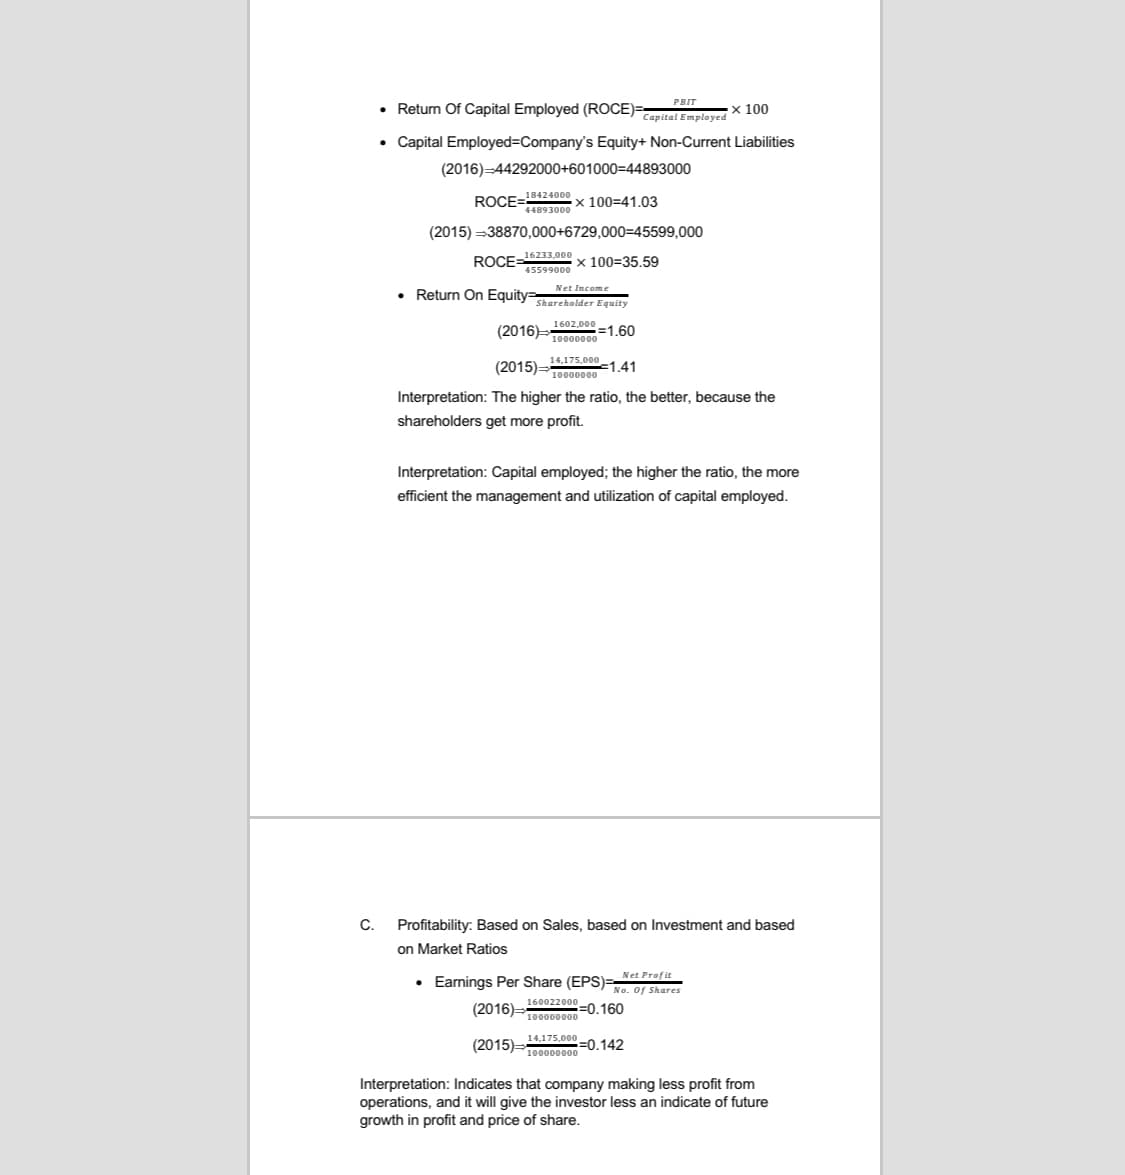
Transcribed Image Text:ROCE .
PBIT
• Return Of Capital Employed (ROCE)=
х 100
Capital Employed
• Capital Employed=Company's Equity+ Non-Current Liabilities
(2016)-44292000+601000=44893000
x 100=41.03
(2015) =38870,000+6729,000=45599,000
ROCE=16233,000 x 100=35.59
45599000
• Return On Equity=ereholder Equity
Net Income
1602,000
10000000
(2015):
14,175,000
10000000
=1,41
Interpretation: The higher the ratio, the better, because the
shareholders get more profit.
Interpretation: Capital employed; the higher the ratio, the more
efficient the management and utilization of capital employed.
C.
Profitability: Based on Sales, based on Investment and based
on Market Ratios
• Earnings Per Share (EPS)=
160022000 -0.160
Net Profit
No. of Shares
(2016)=10000000
14,175,000
(2015)=
=0.142
100000000
Interpretation: Indicates that company making less profit from
operations, and it will give the investor less an indicate of future
growth in profit and price of share.
Expert Solution
This question has been solved!
Explore an expertly crafted, step-by-step solution for a thorough understanding of key concepts.
Step by step
Solved in 3 steps

Knowledge Booster
Learn more about
Need a deep-dive on the concept behind this application? Look no further. Learn more about this topic, accounting and related others by exploring similar questions and additional content below.Recommended textbooks for you


EBK CONTEMPORARY FINANCIAL MANAGEMENT
Finance
ISBN:
9781337514835
Author:
MOYER
Publisher:
CENGAGE LEARNING - CONSIGNMENT

Fundamentals Of Financial Management, Concise Edi…
Finance
ISBN:
9781337902571
Author:
Eugene F. Brigham, Joel F. Houston
Publisher:
Cengage Learning


EBK CONTEMPORARY FINANCIAL MANAGEMENT
Finance
ISBN:
9781337514835
Author:
MOYER
Publisher:
CENGAGE LEARNING - CONSIGNMENT

Fundamentals Of Financial Management, Concise Edi…
Finance
ISBN:
9781337902571
Author:
Eugene F. Brigham, Joel F. Houston
Publisher:
Cengage Learning

Cornerstones of Financial Accounting
Accounting
ISBN:
9781337690881
Author:
Jay Rich, Jeff Jones
Publisher:
Cengage Learning

Financial Accounting: The Impact on Decision Make…
Accounting
ISBN:
9781305654174
Author:
Gary A. Porter, Curtis L. Norton
Publisher:
Cengage Learning