a) Calculate the following ratios for 2016 and 2015, showing detailed calculations as to how you arrive at each number. A ROE B Gross profit margin C Total asset turnover D Inventory turnover E Current ratio F Debt-to-equity G Interest coverage ratio. b) Using the financial statements and the ratios calculated above (and any other ratios you like to calculate), discuss the performance of Cobham PLC in 2016. c) Critically discuss the need for the public limited companies to prepare a Statement of Cash Flows and explain the usefulness of the information contained therein from the perspective of a financial analyst.
a) Calculate the following ratios for 2016 and 2015, showing detailed calculations as to how you arrive at each number. A ROE B Gross profit margin C Total asset turnover D Inventory turnover E Current ratio F Debt-to-equity G Interest coverage ratio. b) Using the financial statements and the ratios calculated above (and any other ratios you like to calculate), discuss the performance of Cobham PLC in 2016. c) Critically discuss the need for the public limited companies to prepare a Statement of Cash Flows and explain the usefulness of the information contained therein from the perspective of a financial analyst.

Century 21 Accounting General Journal
11th Edition
ISBN:9781337680059
Author:Gilbertson
Publisher:Gilbertson
Chapter17: Financial Statement Analysis
Section: Chapter Questions
Problem 4AP

Related questions
Question
a) Calculate the following ratios for 2016 and 2015, showing detailed calculations as to how you arrive at each number.
A ROE
B Gross profit margin
C Total asset turnover
D Inventory turnover
E
F Debt-to-equity
G Interest coverage ratio.
b) Using the financial statements and the ratios calculated above (and any other ratios you like to calculate), discuss the performance of Cobham PLC in 2016.
c) Critically discuss the need for the public limited companies to prepare a Statement of Cash Flows and explain the usefulness of the information contained therein from the perspective of a financial analyst.
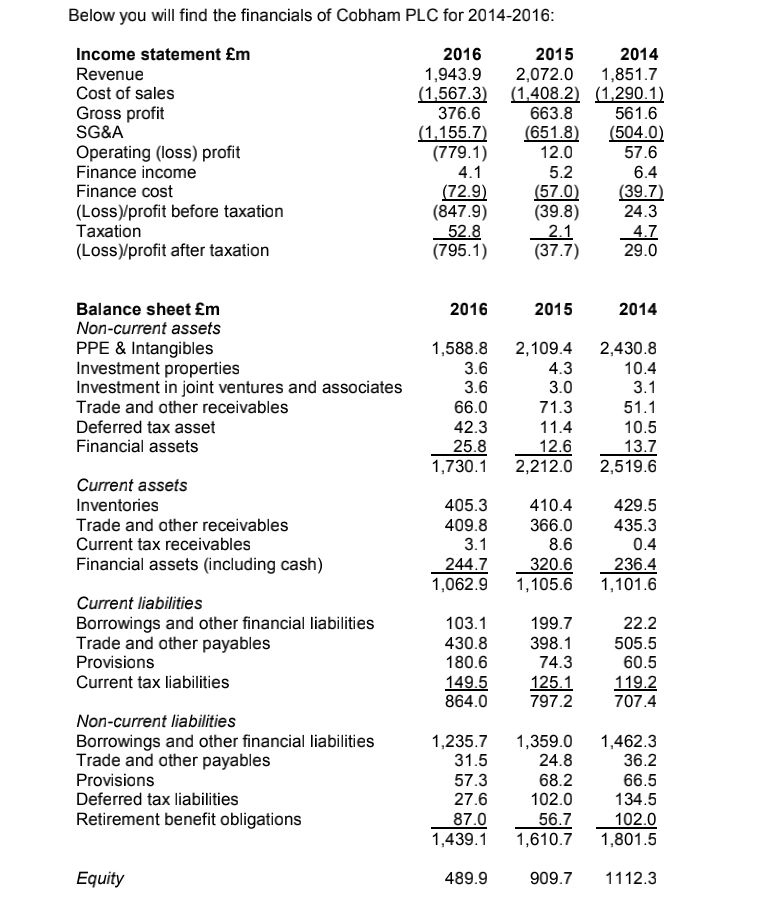
Transcribed Image Text:Below you will find the financials of Cobham PLC for 2014-2016:
Income statement £m
2016
2015
2014
Revenue
2,072.0
(1,567.3) (1,408.2) (1,290.1)
663.8
1,943.9
1,851.7
Cost of sales
Gross profit
SG&A
376.6
561.6
(1,155.7)
(779.1)
4.1
(651.8)
12.0
(504.0)
57.6
Operating (loss) profit
Finance income
5.2
6.4
(39.7)
24.3
Finance cost
(72.9)
(847.9)
52.8
(795.1)
(57.0)
(39.8)
2.1
(37.7)
(Loss)/profit before taxation
Тахation
4.7
29.0
(Loss)/profit after taxation
Balance sheet £m
Non-current assets
PPE & Intangibles
Investment properties
Investment in joint ventures and associates
Trade and other receivables
Deferred tax asset
2016
2015
2014
1,588.8
2,109.4
4.3
3.0
2,430.8
10.4
3.1
3.6
3.6
66.0
42.3
71.3
11.4
51.1
10.5
12.6
2,212.0
Financial assets
25.8
1,730.1
13.7
2,519.6
Current assets
Inventories
405.3
410.4
429.5
Trade and other receivables
409.8
366.0
435.3
Current tax receivables
3.1
8.6
0.4
Financial assets (including cash)
244.7
1,062.9
320.6
1,105.6
236.4
1,101.6
Current liabilities
Borrowings and other financial liabilities
Trade and other payables
103.1
199.7
22.2
398.1
505.5
Provisions
180.6
74.3
60.5
Current tax liabilities
149.5
864.0
125.1
797.2
119.2
707.4
Non-current liabilities
1,462.3
36.2
Borrowings and other financial liabilities
Trade and other payables
Provisions
Deferred tax liabilities
1,235.7
31.5
1,359.0
24.8
68.2
57.3
27.6
66.5
134.5
102.0
1,801.5
102.0
Retirement benefit obligations
87.0
1,439.1
56.7
1,610.7
Equity
489.9
909.7
1112.3
Expert Solution
This question has been solved!
Explore an expertly crafted, step-by-step solution for a thorough understanding of key concepts.

This is a popular solution!

Trending now
This is a popular solution!

Step by step
Solved in 2 steps with 3 images

Knowledge Booster


Learn more about
Need a deep-dive on the concept behind this application? Look no further. Learn more about this topic, accounting and related others by exploring similar questions and additional content below.Recommended textbooks for you

Financial & Managerial Accounting
Accounting
ISBN:
9781285866307
Author:
Carl Warren, James M. Reeve, Jonathan Duchac
Publisher:
Cengage Learning

College Accounting, Chapters 1-27 (New in Account…
Accounting
ISBN:
9781305666160
Author:
James A. Heintz, Robert W. Parry
Publisher:
Cengage Learning
Financial & Managerial Accounting
Accounting
ISBN:
9781285866307
Author:
Carl Warren, James M. Reeve, Jonathan Duchac
Publisher:
Cengage Learning
College Accounting, Chapters 1-27 (New in Account…
Accounting
ISBN:
9781305666160
Author:
James A. Heintz, Robert W. Parry
Publisher:
Cengage Learning

Fundamentals of Financial Management (MindTap Cou…
Finance
ISBN:
9781337395250
Author:
Eugene F. Brigham, Joel F. Houston
Publisher:
Cengage Learning

Survey of Accounting (Accounting I)
Accounting
ISBN:
9781305961883
Author:
Carl Warren
Publisher:
Cengage Learning

PFIN (with PFIN Online, 1 term (6 months) Printed…
Finance
ISBN:
9781337117005
Author:
Randall Billingsley, Lawrence J. Gitman, Michael D. Joehnk
Publisher:
Cengage Learning