Jason draws a scatter plot and a line to represent the relationship between a student's math test scores and the number of classes for Math Test Scores 100 - 80 60 40 20 2 4 Number of Classes Absent 10 Which statement is true? O Jason draws a reasonable estimate for the line-of-best fit because some points are above the line, and some are below the line. O Jason draws a reasonable estimate for the line-of-best fit because two points pass through the line. O Jason does not draw a reasonable estimate for the line-of-best fit because most of the points lie below the line. O Jason does not draw a reasonable estimate for the line-of-best fit because the line does not pass as close as possible to all points. 1 Calculator
Jason draws a scatter plot and a line to represent the relationship between a student's math test scores and the number of classes for Math Test Scores 100 - 80 60 40 20 2 4 Number of Classes Absent 10 Which statement is true? O Jason draws a reasonable estimate for the line-of-best fit because some points are above the line, and some are below the line. O Jason draws a reasonable estimate for the line-of-best fit because two points pass through the line. O Jason does not draw a reasonable estimate for the line-of-best fit because most of the points lie below the line. O Jason does not draw a reasonable estimate for the line-of-best fit because the line does not pass as close as possible to all points. 1 Calculator

Big Ideas Math A Bridge To Success Algebra 1: Student Edition 2015
1st Edition
ISBN:9781680331141
Author:HOUGHTON MIFFLIN HARCOURT
Publisher:HOUGHTON MIFFLIN HARCOURT
Chapter11: Data Analysis And Displays
Section: Chapter Questions
Problem 6CA

Related questions

Question
Answer clearly
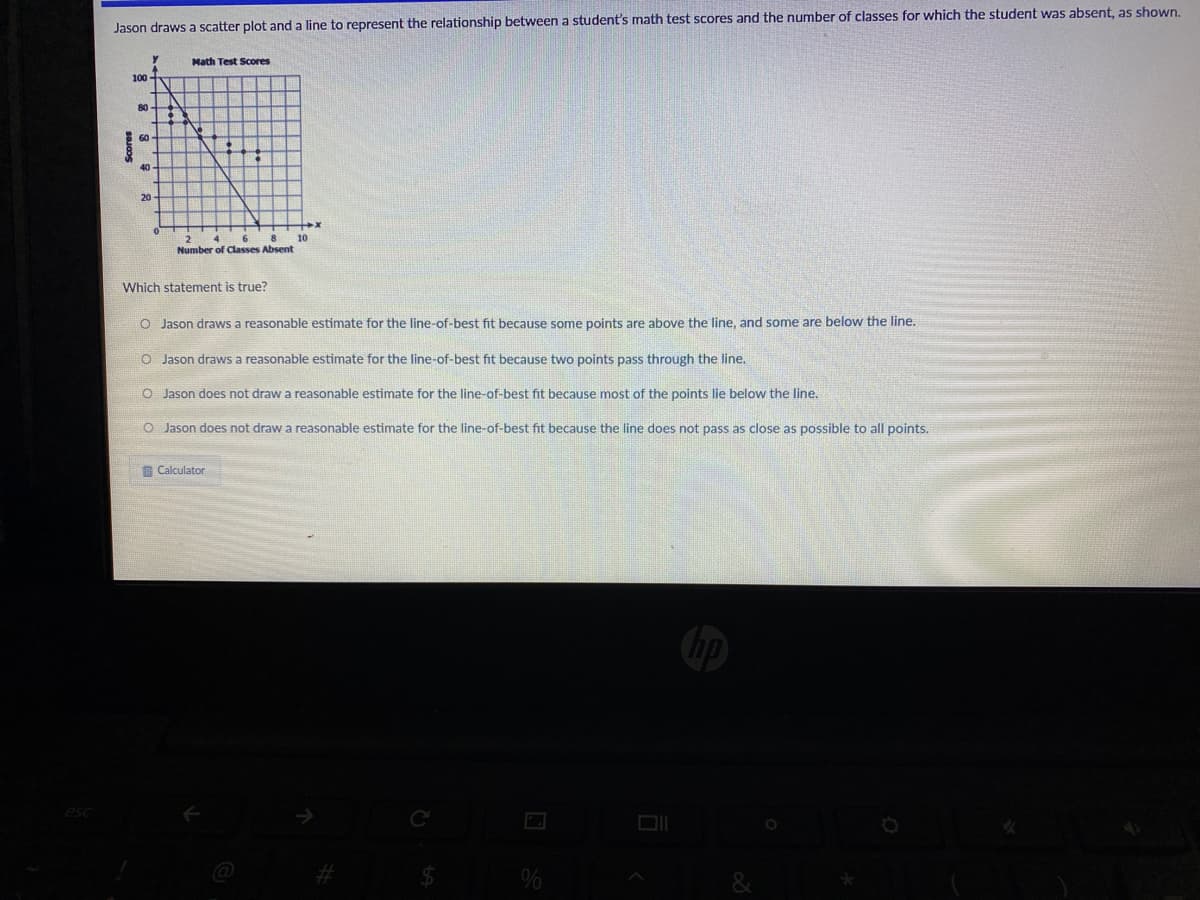
Transcribed Image Text:Jason draws a scatter plot and a line to represent the relationship between a student's math test scores and the number of classes for which the student was absent, as shown.
Math Test Scores
100
80-
40
20
10
Number of Classes Absent
Which statement is true?
O Jason draws a reasonable estimate for the line-of-best fit because some points are above the line, and some are below the line.
O Jason draws a reasonable estimate for the line-of-best fit because two points pass through the line.
O Jason does not draw a reasonable estimate for the line-of-best fit because most of the points lie below the line.
O Jason does not draw a reasonable estimate for the line-of-best fit because the line does not pass as close as possible to all points.
1 Calculator
esc
Expert Solution
This question has been solved!
Explore an expertly crafted, step-by-step solution for a thorough understanding of key concepts.

This is a popular solution!

Trending now
This is a popular solution!

Step by step
Solved in 2 steps with 2 images

Knowledge Booster


Learn more about
Need a deep-dive on the concept behind this application? Look no further. Learn more about this topic, algebra and related others by exploring similar questions and additional content below.Recommended textbooks for you
Big Ideas Math A Bridge To Success Algebra 1: Stu…
Algebra
ISBN:
9781680331141
Author:
HOUGHTON MIFFLIN HARCOURT
Publisher:
Houghton Mifflin Harcourt

Glencoe Algebra 1, Student Edition, 9780079039897…
Algebra
ISBN:
9780079039897
Author:
Carter
Publisher:
McGraw Hill

Holt Mcdougal Larson Pre-algebra: Student Edition…
Algebra
ISBN:
9780547587776
Author:
HOLT MCDOUGAL
Publisher:
HOLT MCDOUGAL
Big Ideas Math A Bridge To Success Algebra 1: Stu…
Algebra
ISBN:
9781680331141
Author:
HOUGHTON MIFFLIN HARCOURT
Publisher:
Houghton Mifflin Harcourt
Glencoe Algebra 1, Student Edition, 9780079039897…
Algebra
ISBN:
9780079039897
Author:
Carter
Publisher:
McGraw Hill
Holt Mcdougal Larson Pre-algebra: Student Edition…
Algebra
ISBN:
9780547587776
Author:
HOLT MCDOUGAL
Publisher:
HOLT MCDOUGAL

College Algebra (MindTap Course List)
Algebra
ISBN:
9781305652231
Author:
R. David Gustafson, Jeff Hughes
Publisher:
Cengage Learning

Algebra and Trigonometry (MindTap Course List)
Algebra
ISBN:
9781305071742
Author:
James Stewart, Lothar Redlin, Saleem Watson
Publisher:
Cengage Learning

College Algebra
Algebra
ISBN:
9781305115545
Author:
James Stewart, Lothar Redlin, Saleem Watson
Publisher:
Cengage Learning