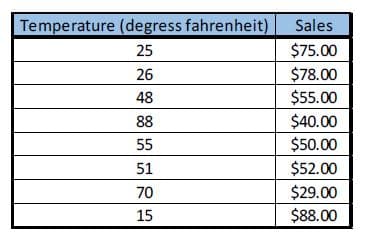
Jim and Larry run a soup stand. The data below represents the sales of soup that they had on 8 randomly selected days, along with the high temperature on that day. a) Create a scatter diagram for this data set and comment on whether there is a positive or negative relationship between these variables. b) Calculate the correlation coefficient between temperature and sales. c) Does a linear relationship exist between these variables? Explain to me why or why not this is the case.


Correlation
Correlation defines a relationship between two independent variables. It tells the degree to which variables move in relation to each other. When two sets of data are related to each other, there is a correlation between them.
Linear Correlation
A correlation is used to determine the relationships between numerical and categorical variables. In other words, it is an indicator of how things are connected to one another. The correlation analysis is the study of how variables are related.
Regression Analysis
Regression analysis is a statistical method in which it estimates the relationship between a dependent variable and one or more independent variable. In simple terms dependent variable is called as outcome variable and independent variable is called as predictors. Regression analysis is one of the methods to find the trends in data. The independent variable used in Regression analysis is named Predictor variable. It offers data of an associated dependent variable regarding a particular outcome.
Jim and Larry run a soup stand. The data below represents the sales of soup that they had on 8 randomly selected days, along with the high temperature on that day.
a) Create a
b) Calculate the
c) Does a linear relationship exist between these variables? Explain to me why or why not this is the case.
d) Using excel, calculate the least squares regression equation for this data set.
e) Using your equation, predict the soup sales on a day where the temperature is 29 degrees.
f) Interpret the slope of this equation.
g) Can we use this data set and regression equation to predict the sales on a day when the average temperature is 102 degrees? Why or why not?
h) What is the R-squared for this equation? How do you interpret that R-squared?


Trending now
This is a popular solution!

Step by step
Solved in 3 steps with 7 images


