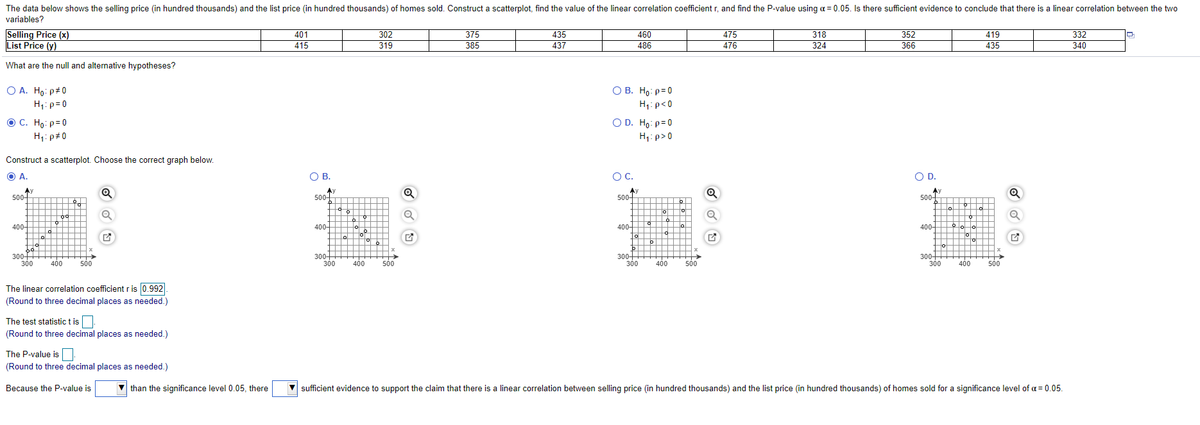
The data below shows the selling price (in hundred thousands) and the list price (in hundred thousands) of homes sold. Construct a scatterplot, find the value of the linear correlation coefficient r, and find the P.value using a=0.05. Is there sufficient evidence to conclude that there is a linear correlation between the two variables? Selling Price (x) List Price (y) 318 324 401 302 375 385 435 460 486 475 352 419 332 415 319 437 476 366 435 340 What are the null and alternative hypotheses? O A. Hg: p#0 H: p=0 OB. He p=0 H pc0 OD. Hg: p=0 OC. Ha p=0 H p>0 Construct a scatterplot Choose the corect graph below. OA. OB. Oc. . OD. s00- 500 s00- s00 *****TT R 400 400 400 400 300 ----> 300 300+++ **-* 400 300 ----- 400 300 400 300 S00 300 500 The linear correlation coefficient r is 0.992 (Round to three decimal places as needed) The test statistic t is (Round to three decimal places as needed.) The Pvalue isn (Round to three decimal places as needed) Because the Pvalue is V than the significance level 0.05, there sufficient evidence to support the claim that there is a linear correlation between selling price (in hundred thousands) and the list price (in hundred thousands) of homes sold for a significance level of a= 0.05.


Minimization
In mathematics, traditional optimization problems are typically expressed in terms of minimization. When we talk about minimizing or maximizing a function, we refer to the maximum and minimum possible values of that function. This can be expressed in terms of global or local range. The definition of minimization in the thesaurus is the process of reducing something to a small amount, value, or position. Minimization (noun) is an instance of belittling or disparagement.
Maxima and Minima
The extreme points of a function are the maximum and the minimum points of the function. A maximum is attained when the function takes the maximum value and a minimum is attained when the function takes the minimum value.
Derivatives
A derivative means a change. Geometrically it can be represented as a line with some steepness. Imagine climbing a mountain which is very steep and 500 meters high. Is it easier to climb? Definitely not! Suppose walking on the road for 500 meters. Which one would be easier? Walking on the road would be much easier than climbing a mountain.
Concavity
In calculus, concavity is a descriptor of mathematics that tells about the shape of the graph. It is the parameter that helps to estimate the maximum and minimum value of any of the functions and the concave nature using the graphical method. We use the first derivative test and second derivative test to understand the concave behavior of the function.
What is the test statistic and p-value?
Because the P-value is
than the significance level
there
sufficient evidence to support the claim that there is a


Trending now
This is a popular solution!

Step by step
Solved in 2 steps with 5 images


