Jobs and productivity! How do retail stores rate? One way to answer this question is to examine annual profits per employee. The following data give annual profits per employee 1 thousand dollars per employee) for companies in retail sales. Assume o = 3.8 thousand dollars. 3.7 6.4 3.9 8.8 8.2 5.2 8.3 5.8 2.6 2.9 8.1 -1.9 11.9 8.2 6.4 4.7 5.5 4.8 3.0 4.3 -6.0 1.5 2.9 4.8 -1.7 9.4 5.5 5.8 4.7 6.2 15.0 4.1 3.7 5.1 4.2 (a) Use a calculator or appropriate computer software to find x for the preceding data. (Round your answer to two decimal places.) thousand dollars per employee (b) Let us say that the preceding data are representative of the entire sector of retail sales companies. Find an 80% confidence interval for u, the average annual profit per employee for retail sales. (Round your answers to two decimal places.) lower limit thousand dollars upper limit thousand dollars (c) Let us say that you are the manager of a retail store with a large number of employees. Suppose the annual profits are less than 3 thousand dollars per employee. Do you thi this might be low compared with other retail stores? Explain by referring to the confidence interval you computed in part (b). O Yes. This confjdence interval suggests that the profits per employee are less than those of other retail stores. O No. This confidence interval suggests that the profits per employee do not differ from those of other retail stores.
Jobs and productivity! How do retail stores rate? One way to answer this question is to examine annual profits per employee. The following data give annual profits per employee 1 thousand dollars per employee) for companies in retail sales. Assume o = 3.8 thousand dollars. 3.7 6.4 3.9 8.8 8.2 5.2 8.3 5.8 2.6 2.9 8.1 -1.9 11.9 8.2 6.4 4.7 5.5 4.8 3.0 4.3 -6.0 1.5 2.9 4.8 -1.7 9.4 5.5 5.8 4.7 6.2 15.0 4.1 3.7 5.1 4.2 (a) Use a calculator or appropriate computer software to find x for the preceding data. (Round your answer to two decimal places.) thousand dollars per employee (b) Let us say that the preceding data are representative of the entire sector of retail sales companies. Find an 80% confidence interval for u, the average annual profit per employee for retail sales. (Round your answers to two decimal places.) lower limit thousand dollars upper limit thousand dollars (c) Let us say that you are the manager of a retail store with a large number of employees. Suppose the annual profits are less than 3 thousand dollars per employee. Do you thi this might be low compared with other retail stores? Explain by referring to the confidence interval you computed in part (b). O Yes. This confjdence interval suggests that the profits per employee are less than those of other retail stores. O No. This confidence interval suggests that the profits per employee do not differ from those of other retail stores.

Functions and Change: A Modeling Approach to College Algebra (MindTap Course List)
6th Edition
ISBN:9781337111348
Author:Bruce Crauder, Benny Evans, Alan Noell
Publisher:Bruce Crauder, Benny Evans, Alan Noell
Chapter5: A Survey Of Other Common Functions
Section5.1: Logistic Functions
Problem 16E: Cable TV The following table shows the number C. in millions, of basic subscribers to cable TV in...

Related questions

Question
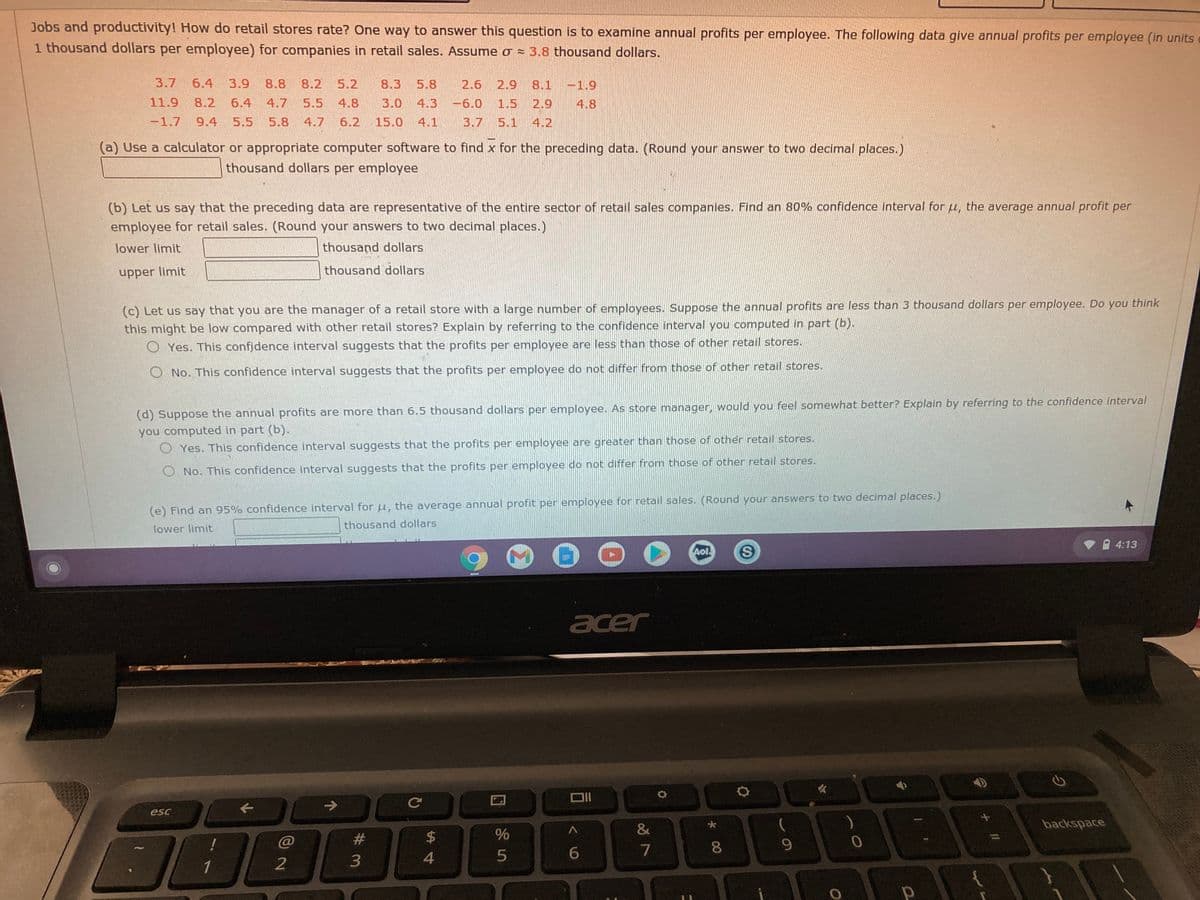
Transcribed Image Text:Jobs and productivity! How do retail stores rate? One way to answer this question is to examine annual profits per employee. The following data give annual profits per employee (in units
1 thousand dollars per employee) for companies in retail sales. Assume o = 3.8 thousand dollars.
3.7
6.4
3.9
8.8
8.2
5.2
8.3
5.8
2.6
2.9
8.1 -1.9
11.9
8.2
6.4
4.7
5.5
4.8
3.0 4.3
-6.0
1.5
2.9
4.8
-1.7
9.4
5.5
5.8
4.7
6.2
15.0 4.1
3.7 5.1
4.2
(a) Use a calculator or appropriate computer software to find x for the preceding data. (Round your answer to two decimal places.)
thousand dollars per employee
(b) Let us say that the preceding data are representative of the entire sector of retail sales companies. Find an 80% confidence interval for u, the average annual profit per
employee for retail sales. (Round your answers to two decimal places.)
lower limit
thousand dollars
thousand dollars
upper limit
(c) Let us say that you are the manager of a retail store with a large number of employees. Suppose the annual profits are less than 3 thousand dollars per employee. Do you think
this might be low compared with other retail stores? Explain by referring to the confidence interval you computed in part (b).
O Yes. This confidence interval suggests that the profits per employee are less than those of other retail stores.
O No. This confidence interval suggests that the profits per employee do not differ from those of other retail stores.
(d) Suppose the annual profits are more than 6.5 thousand dollars per employee. As store manager, would you feel somewhat better? Explain by referring to the confidence interval
you computed in part (b).
O Yes. This confidence interval suggests that the profits per employee are greater than those of other retail stores.
O No. This confidence interval suggests that the profits per employee do not differ from those of other retail stores.
(e) Find an 95% confidence interval for u, the average annual profit per employee for retail sales. (Round your answers to two decimal places.)
lower limit
thousand dollars
4:13
Aol
acer
->
esc
&
backspace
#
2$
7
8.
9.
6.
3
1
回 5
Expert Solution
This question has been solved!
Explore an expertly crafted, step-by-step solution for a thorough understanding of key concepts.

This is a popular solution!

Trending now
This is a popular solution!

Step by step
Solved in 2 steps with 1 images

Knowledge Booster


Learn more about
Need a deep-dive on the concept behind this application? Look no further. Learn more about this topic, statistics and related others by exploring similar questions and additional content below.Recommended textbooks for you
Functions and Change: A Modeling Approach to Coll…
Algebra
ISBN:
9781337111348
Author:
Bruce Crauder, Benny Evans, Alan Noell
Publisher:
Cengage Learning

Linear Algebra: A Modern Introduction
Algebra
ISBN:
9781285463247
Author:
David Poole
Publisher:
Cengage Learning

Glencoe Algebra 1, Student Edition, 9780079039897…
Algebra
ISBN:
9780079039897
Author:
Carter
Publisher:
McGraw Hill
Functions and Change: A Modeling Approach to Coll…
Algebra
ISBN:
9781337111348
Author:
Bruce Crauder, Benny Evans, Alan Noell
Publisher:
Cengage Learning
Linear Algebra: A Modern Introduction
Algebra
ISBN:
9781285463247
Author:
David Poole
Publisher:
Cengage Learning
Glencoe Algebra 1, Student Edition, 9780079039897…
Algebra
ISBN:
9780079039897
Author:
Carter
Publisher:
McGraw Hill