John M 8.8 Nancy Tim F 2.1 M 6.0 George Alan Lisa M 1.1 M 9.2 F 3.3 Anne F 2.7 What does sex discrimination in employment mean and how can it be measured?
John M 8.8 Nancy Tim F 2.1 M 6.0 George Alan Lisa M 1.1 M 9.2 F 3.3 Anne F 2.7 What does sex discrimination in employment mean and how can it be measured?

Glencoe Algebra 1, Student Edition, 9780079039897, 0079039898, 2018
18th Edition
ISBN:9780079039897
Author:Carter
Publisher:Carter
Chapter10: Statistics
Section10.6: Summarizing Categorical Data
Problem 30PPS

Related questions
Question
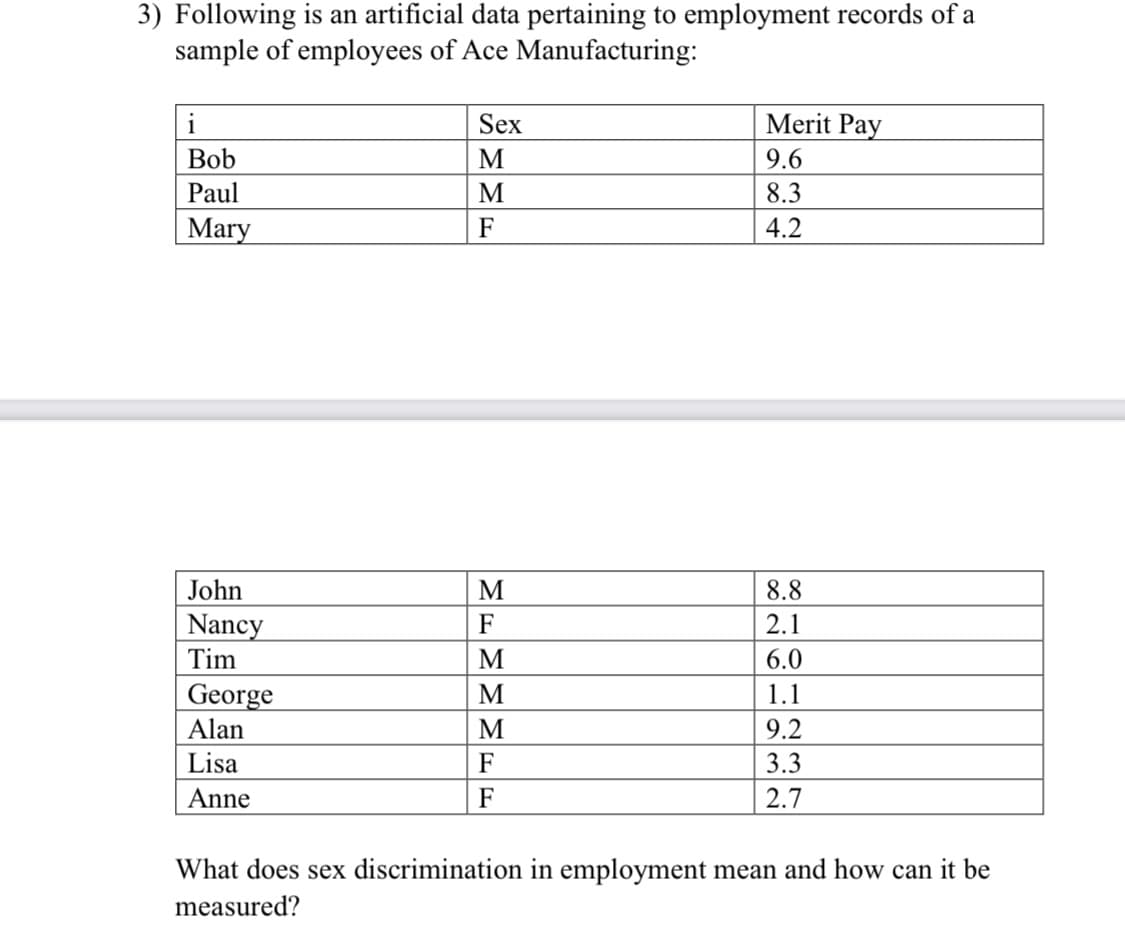
Transcribed Image Text:3) Following is an artificial data pertaining to employment records of a
sample of employees of Ace Manufacturing:
i
Sex
Merit Pay
Bob
M
9.6
Paul
M
8.3
Mary
F
4.2
John
M
8.8
Nancy
Tim
F
2.1
M
6.0
George
Alan
M
1.1
M
9.2
Lisa
F
3.3
Anne
F
2.7
What does sex discrimination in employment mean and how can it be
measured?
Expert Solution
This question has been solved!
Explore an expertly crafted, step-by-step solution for a thorough understanding of key concepts.

Step by step
Solved in 2 steps

Recommended textbooks for you
Glencoe Algebra 1, Student Edition, 9780079039897…
Algebra
ISBN:
9780079039897
Author:
Carter
Publisher:
McGraw Hill

College Algebra (MindTap Course List)
Algebra
ISBN:
9781305652231
Author:
R. David Gustafson, Jeff Hughes
Publisher:
Cengage Learning

Glencoe Algebra 1, Student Edition, 9780079039897…
Algebra
ISBN:
9780079039897
Author:
Carter
Publisher:
McGraw Hill
College Algebra (MindTap Course List)
Algebra
ISBN:
9781305652231
Author:
R. David Gustafson, Jeff Hughes
Publisher:
Cengage Learning