Jse the t-distribution table to find the critical value(s) for the indicated alternative hypotheses, level of significance a, and sample sizes n, and ng. Assume that the samples are independent, normal, and random. Answer parts (a) and (b). H: H ), use "One Tail, a column with a positive sign two-tailed (#), use "Two Tails, a column with a negative and a positive sign. (a) Find the critical value assuming that the population variances are equal. Read the T Table when d.f. =n,+ ng -2 (Type an integer or decimal rounded to three decimal places as needed. Use a comma to separate answers as needed.) (b) Find the critical value assuming that the population variances are not equal. Read the T Table when d.f.= smaller of n-1 or n2 -1 (Type an integer or decimal rounded to three decimal places as needed. Use a comma to separate answers as needed.)
Jse the t-distribution table to find the critical value(s) for the indicated alternative hypotheses, level of significance a, and sample sizes n, and ng. Assume that the samples are independent, normal, and random. Answer parts (a) and (b). H: H ), use "One Tail, a column with a positive sign two-tailed (#), use "Two Tails, a column with a negative and a positive sign. (a) Find the critical value assuming that the population variances are equal. Read the T Table when d.f. =n,+ ng -2 (Type an integer or decimal rounded to three decimal places as needed. Use a comma to separate answers as needed.) (b) Find the critical value assuming that the population variances are not equal. Read the T Table when d.f.= smaller of n-1 or n2 -1 (Type an integer or decimal rounded to three decimal places as needed. Use a comma to separate answers as needed.)

Glencoe Algebra 1, Student Edition, 9780079039897, 0079039898, 2018
18th Edition
ISBN:9780079039897
Author:Carter
Publisher:Carter
Chapter10: Statistics
Section10.5: Comparing Sets Of Data
Problem 14PPS

Related questions
Question
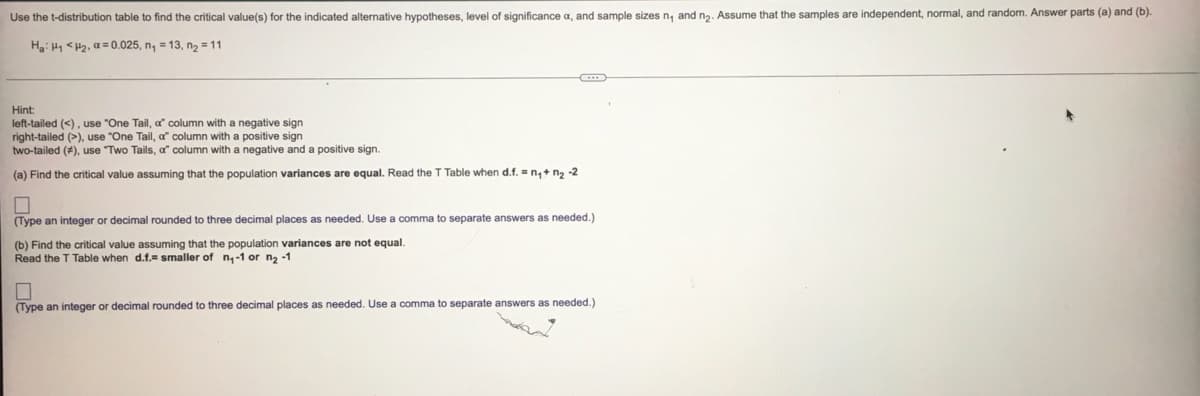
Transcribed Image Text:Use the t-distribution table to find the critical value(s) for the indicated alternative hypotheses, level of significance a, and sample sizes n, and n2. Assume that the samples are independent, normal, and random. Answer parts (a) and (b).
Ha: H1 <H2, a = 0.025, n, = 13, n2 = 11
Hint:
left-tailed (<), use "One Tail, a column with a negative sign
right-tailed (>), use "One Tail, a column with a positive sign
two-tailed (#), use "Two Tails, a" column with a negative and a positive sign.
(a) Find the critical value assuming that the population variances are equal. Read the T Table when d.f. = n,+ ng -2
(Type an integer or decimal rounded to three decimal places as needed. Use a comma to separate answers as needed.)
(b) Find the critical value assuming that the population variances are not equal.
Read the T Table when d.f.= smaller of n-1 or n2 -1
(Type an integer or decimal rounded to three decimal places as needed. Use a comma to separate answers as needed.)
Expert Solution
This question has been solved!
Explore an expertly crafted, step-by-step solution for a thorough understanding of key concepts.

This is a popular solution!

Trending now
This is a popular solution!

Step by step
Solved in 2 steps with 1 images

Recommended textbooks for you
Glencoe Algebra 1, Student Edition, 9780079039897…
Algebra
ISBN:
9780079039897
Author:
Carter
Publisher:
McGraw Hill
Glencoe Algebra 1, Student Edition, 9780079039897…
Algebra
ISBN:
9780079039897
Author:
Carter
Publisher:
McGraw Hill