Julie was testing how far two new electric cars-model A and model B-could drive on a full charge. She obtained a sample of 5 new cars of each model, charged them fully, and drove them as far as she could along a controlled route. Here is a summary of the distances: Distance Model A Model B Mean 168 km 172 km Standard deviation 5.4 km 7.5 km Number of cars 5 5 Julie wants to use these results to test Ho: HA - HB = 0 versus Hạ: Ha – HB # 0. Assume that these are representative samples and all other conditions have been met. What is the P-value associated with these sample results? 0.10 < P-value < 0.20 0.05 < P-value < 0.10 P-value < 0.01 0.01< P-value < 0.05 P-value > 0.20
Julie was testing how far two new electric cars-model A and model B-could drive on a full charge. She obtained a sample of 5 new cars of each model, charged them fully, and drove them as far as she could along a controlled route. Here is a summary of the distances: Distance Model A Model B Mean 168 km 172 km Standard deviation 5.4 km 7.5 km Number of cars 5 5 Julie wants to use these results to test Ho: HA - HB = 0 versus Hạ: Ha – HB # 0. Assume that these are representative samples and all other conditions have been met. What is the P-value associated with these sample results? 0.10 < P-value < 0.20 0.05 < P-value < 0.10 P-value < 0.01 0.01< P-value < 0.05 P-value > 0.20

Glencoe Algebra 1, Student Edition, 9780079039897, 0079039898, 2018
18th Edition
ISBN:9780079039897
Author:Carter
Publisher:Carter
Chapter10: Statistics
Section10.3: Measures Of Spread
Problem 1GP

Related questions

Topic Video
Question
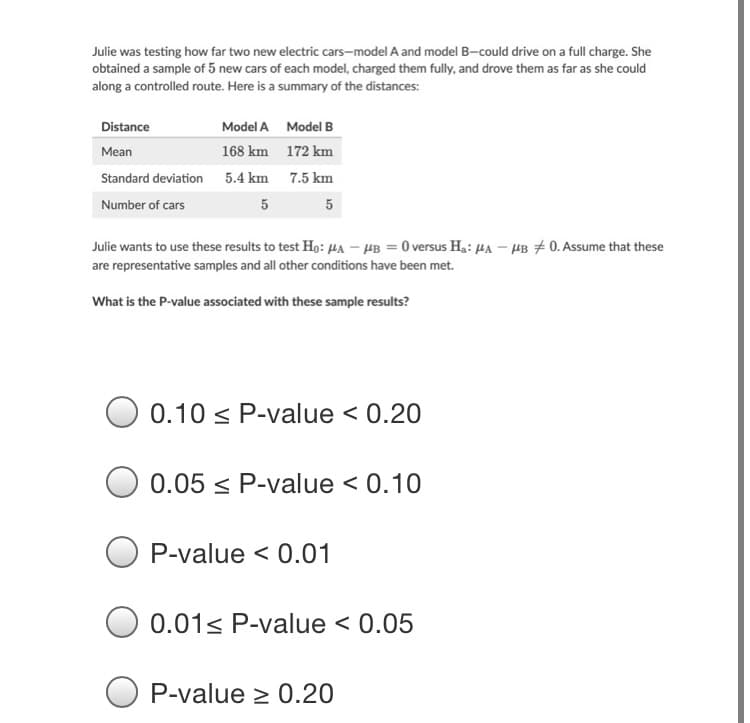
Transcribed Image Text:Julie was testing how far two new electric cars-model A and model B-could drive on a full charge. She
obtained a sample of 5 new cars of each model, charged them fully, and drove them as far as she could
along a controlled route. Here is a summary of the distances:
Distance
Model A Model B
Mean
168 km 172 km
Standard deviation 5.4 km 7.5 km
Number of cars
5
5
Julie wants to use these results to test Ho: Ha – HB = 0 versus Ha: µA – HB + 0. Assume that these
are representative samples and all other conditions have been met.
What is the P-value associated with these sample results?
0.10 < P-value < 0.20
0.05 < P-value < 0.10
P-value < 0.01
0.01< P-value < 0.05
O P-value > 0.20
Expert Solution
This question has been solved!
Explore an expertly crafted, step-by-step solution for a thorough understanding of key concepts.

This is a popular solution!

Trending now
This is a popular solution!

Step by step
Solved in 2 steps with 1 images

Knowledge Booster


Learn more about
Need a deep-dive on the concept behind this application? Look no further. Learn more about this topic, statistics and related others by exploring similar questions and additional content below.Recommended textbooks for you
Glencoe Algebra 1, Student Edition, 9780079039897…
Algebra
ISBN:
9780079039897
Author:
Carter
Publisher:
McGraw Hill
Glencoe Algebra 1, Student Edition, 9780079039897…
Algebra
ISBN:
9780079039897
Author:
Carter
Publisher:
McGraw Hill