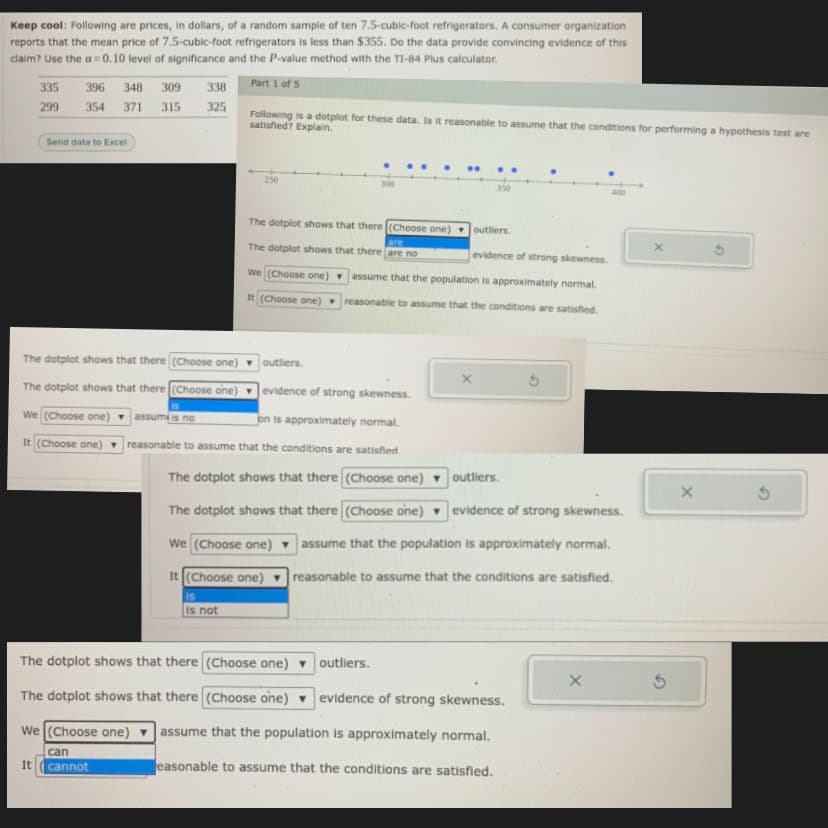
Keep cool: Following are prices, in dollars, of a random sample of ten 7.5-cubic-foot refrigerators. A consumer organization reports that the mean price of 7.5-cubic-foot refrigerators is less than $355. Do the data provide convincing evidence of this claim? Use the a 0.10 level of significance and the P-value method with the TI-84 Plus calculator. Part 1 of 5 335 396 348 309 338 299 354 371 315 325 Following is a dotplot for these data. Is it reasonable to assume that the conditions for performing a hypothesis test are satisfled? Explain. Send data to Excel .. 250 300 350 400 The dotplot shows that there (Choose one) outliers. are The dotplot shows that there are no evidence of strong skewness. We (Choose one) assume that the population is approximately normal. It (Choose one) reasonable to assume that the conditions are satisfied.
Keep cool: Following are prices, in dollars, of a random sample of ten 7.5-cubic-foot refrigerators. A consumer organization reports that the mean price of 7.5-cubic-foot refrigerators is less than $355. Do the data provide convincing evidence of this claim? Use the a 0.10 level of significance and the P-value method with the TI-84 Plus calculator. Part 1 of 5 335 396 348 309 338 299 354 371 315 325 Following is a dotplot for these data. Is it reasonable to assume that the conditions for performing a hypothesis test are satisfled? Explain. Send data to Excel .. 250 300 350 400 The dotplot shows that there (Choose one) outliers. are The dotplot shows that there are no evidence of strong skewness. We (Choose one) assume that the population is approximately normal. It (Choose one) reasonable to assume that the conditions are satisfied.

MATLAB: An Introduction with Applications
6th Edition
ISBN:9781119256830
Author:Amos Gilat
Publisher:Amos Gilat
Chapter1: Starting With Matlab
Section: Chapter Questions
Problem 1P

Related questions
Question
Keep cool: Following are prices, in dollars, of a random sample of ten 7.5-cubic-foot refrigerators. A consumer organization
reports that the mean price of 7.5-cubic-foot refrigerators is less than $355. Do the data provide convincing evidence of this
claim? Use the a = 0.10 level of significance and the P-value method with the TI-84 Plus calculator. Answer the following.
Transcribed Image Text:Keep cool: Following are prices, in dollars, of a random sample of ten 7.5-cubic-foot refrigerators. A consumer organization
reports that the mean price of 7.5-cubic-foot refrigerators is less than $355. Do the data provide convincing evidence of this
claim? Use the a = 0.10 level of significance and the P-value method with the TI-84 Plus calculator.
335
396
348
309
338
Part 1 of 5
299
354
371
315
325
Following is a dotplot for these data. Is it reasonable to assume that the conditions for performing a hypothesis test are
satisfled? Explain.
Send data to Excel
250
300
350
The dotplot shows that there (Choose one) outliers.
are
The dotplot shows that there are no
evidence of strong skewness.
We (Choose one) assume that the population is approximately normal.
It (Choose one) reasonable to assume that the conditions are satisfied.
The dotplot shows that there (Choose one)
outliers.
The dotplot shows that there (Choose one)
evidence of strong skewness.
We (Choose one) assumi is no
on is approximately normal.
It (Choose one) v reasonable to assume that the conditions are satisfied
The dotplot shows that there (Choose one) outliers.
The dotplot shows that there (Choose one) evidence of strong skewness.
We (Choose one) ▼
assume that the population is approximately normal.
It (Choose one) reasonable to assume that the conditions are satisfled.
is
is not
The dotplot shows that there (Choose one) outliers.
The dotplot shows that there (Choose one)
evidence of strong skewness.
We (Choose one)
assume that the population is approximately normal.
can
It
cannot
easonable to assume that the conditions are satisfied.
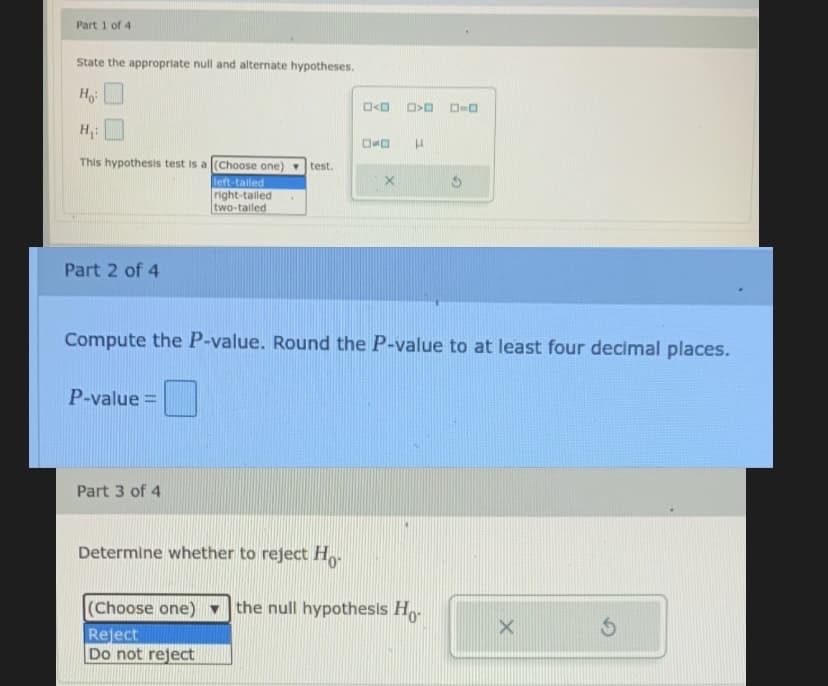
Transcribed Image Text:Part 1 of 4
State the appropriate null and alternate hypotheses.
Ho
This hypothesis test is a (Choose one) v test.
left-tailed
right-talled
two-tailed
Part 2 of 4
Compute the P-value. Round the P-value to at least four decimal places.
P-value =
Part 3 of 4
Determine whether to reject H
(Choose one)
the null hypothesis H.
Reject
Do not reject
Expert Solution
This question has been solved!
Explore an expertly crafted, step-by-step solution for a thorough understanding of key concepts.

This is a popular solution!

Trending now
This is a popular solution!

Step by step
Solved in 2 steps with 1 images

Recommended textbooks for you
MATLAB: An Introduction with Applications
Statistics
ISBN:
9781119256830
Author:
Amos Gilat
Publisher:
John Wiley & Sons Inc

Probability and Statistics for Engineering and th…
Statistics
ISBN:
9781305251809
Author:
Jay L. Devore
Publisher:
Cengage Learning

Statistics for The Behavioral Sciences (MindTap C…
Statistics
ISBN:
9781305504912
Author:
Frederick J Gravetter, Larry B. Wallnau
Publisher:
Cengage Learning
MATLAB: An Introduction with Applications
Statistics
ISBN:
9781119256830
Author:
Amos Gilat
Publisher:
John Wiley & Sons Inc
Probability and Statistics for Engineering and th…
Statistics
ISBN:
9781305251809
Author:
Jay L. Devore
Publisher:
Cengage Learning
Statistics for The Behavioral Sciences (MindTap C…
Statistics
ISBN:
9781305504912
Author:
Frederick J Gravetter, Larry B. Wallnau
Publisher:
Cengage Learning

Elementary Statistics: Picturing the World (7th E…
Statistics
ISBN:
9780134683416
Author:
Ron Larson, Betsy Farber
Publisher:
PEARSON

The Basic Practice of Statistics
Statistics
ISBN:
9781319042578
Author:
David S. Moore, William I. Notz, Michael A. Fligner
Publisher:
W. H. Freeman

Introduction to the Practice of Statistics
Statistics
ISBN:
9781319013387
Author:
David S. Moore, George P. McCabe, Bruce A. Craig
Publisher:
W. H. Freeman