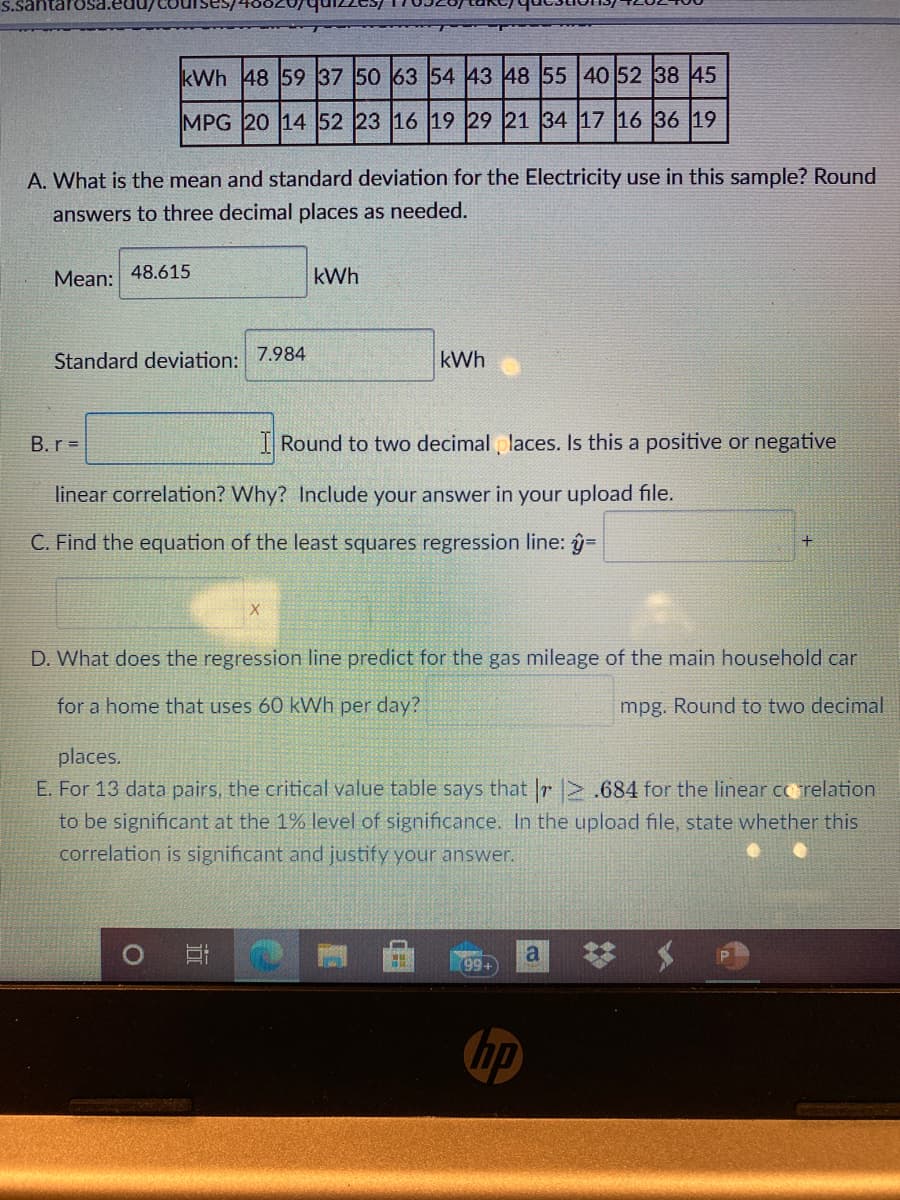
kWh 48 59 37 50 63 54 43 48 55 40 52 38 45 MPG 20 14 52 23 16 19 29 21 34 17 16 36 19 A. What is the mean and standard deviation for the Electricity use in this sample? Round answers to three decimal places as needed. Mean: 48.615 kWh Standard deviation: 7.984 kWh B. r = I Round to two decimal laces. Is this a positive or negative linear correlation? Why? Include your answer in your upload file. C. Find the equation of the least squares regression line: ŷ= + D. What does the regression line predict for the gas mileage of the main household car for a home that uses 60 kWh per day? mpg. Round to two decimal places. E. For 13 data pairs, the critical value table says that |r > .684 for the linear c relation to be significant at the 1% level of significance. In the upload file, state whether this correlation is significant and justify your answer.


Inverse Normal Distribution
The method used for finding the corresponding z-critical value in a normal distribution using the known probability is said to be an inverse normal distribution. The inverse normal distribution is a continuous probability distribution with a family of two parameters.
Mean, Median, Mode
It is a descriptive summary of a data set. It can be defined by using some of the measures. The central tendencies do not provide information regarding individual data from the dataset. However, they give a summary of the data set. The central tendency or measure of central tendency is a central or typical value for a probability distribution.
Z-Scores
A z-score is a unit of measurement used in statistics to describe the position of a raw score in terms of its distance from the mean, measured with reference to standard deviation from the mean. Z-scores are useful in statistics because they allow comparison between two scores that belong to different normal distributions.


Trending now
This is a popular solution!

Step by step
Solved in 2 steps


