Click here to view the data table. Click here to view the table of critical values for the Pearson correlation coefficient. - X Data Table 130- 68- 120- 64- 110- 60- Height, x IQ score, y 100- 56- 63 107 90 52 52+ 90 130 68 Height (inches) 59 100 Height (inches) 64 103 67 112 (b) Calculate the sample correlation coeffic 58 93 r= -0.049 63 109 Round to three decimal places as needed 65 116 55 127 c) Describe the type of correlation, if any, There is linear corr Print Done Help me solve this View an ear all Check answe IQ score IQ score
Click here to view the data table. Click here to view the table of critical values for the Pearson correlation coefficient. - X Data Table 130- 68- 120- 64- 110- 60- Height, x IQ score, y 100- 56- 63 107 90 52 52+ 90 130 68 Height (inches) 59 100 Height (inches) 64 103 67 112 (b) Calculate the sample correlation coeffic 58 93 r= -0.049 63 109 Round to three decimal places as needed 65 116 55 127 c) Describe the type of correlation, if any, There is linear corr Print Done Help me solve this View an ear all Check answe IQ score IQ score

Glencoe Algebra 1, Student Edition, 9780079039897, 0079039898, 2018
18th Edition
ISBN:9780079039897
Author:Carter
Publisher:Carter
Chapter4: Equations Of Linear Functions
Section4.5: Correlation And Causation
Problem 24PFA

Related questions
Question
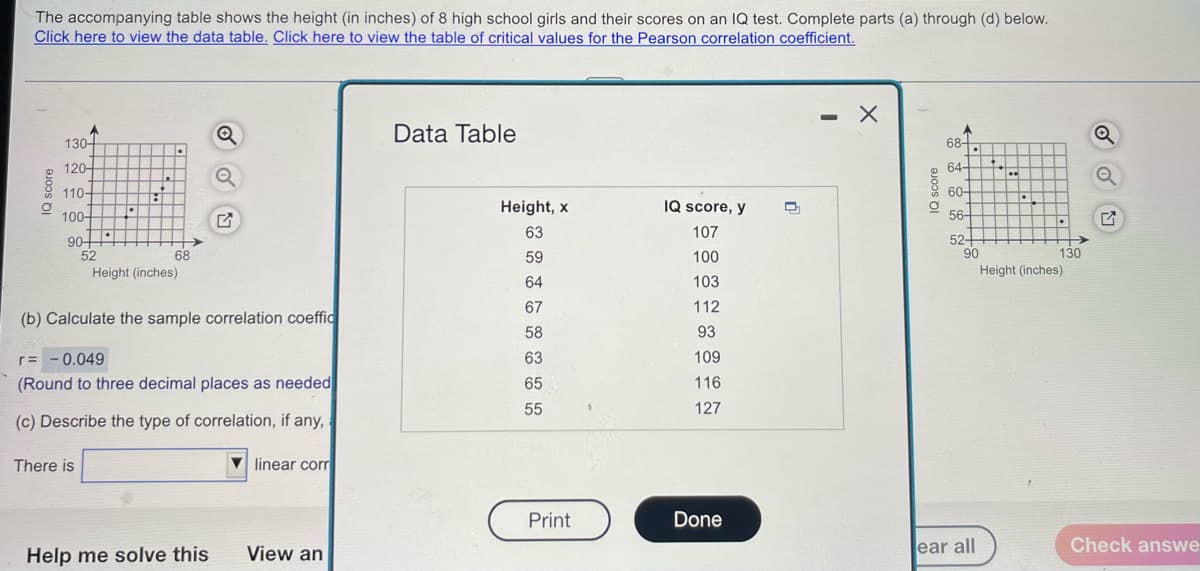
Transcribed Image Text:The accompanying table shows the height (in inches) of 8 high school girls and their scores on an IQ test. Complete parts (a) through (d) below.
Click here to view the data table. Click here to view the table of critical values for the Pearson correlation coefficient.
- X
Data Table
130-
68-
120-
64+
110-
60-
Height, x
IQ score, y
100-
56-
63
107
901
52
52+
90
68
59
100
130
Height (inches)
Height (inches)
64
103
67
112
(b) Calculate the sample correlation coeffic
58
93
r= - 0.049
63
109
(Round to three decimal places as needed
65
116
55
127
(c) Describe the type of correlation, if any,
There is
V
linear corr
Print
Done
Help me solve this
View an
ear all
Check answe
Q score
IQ score
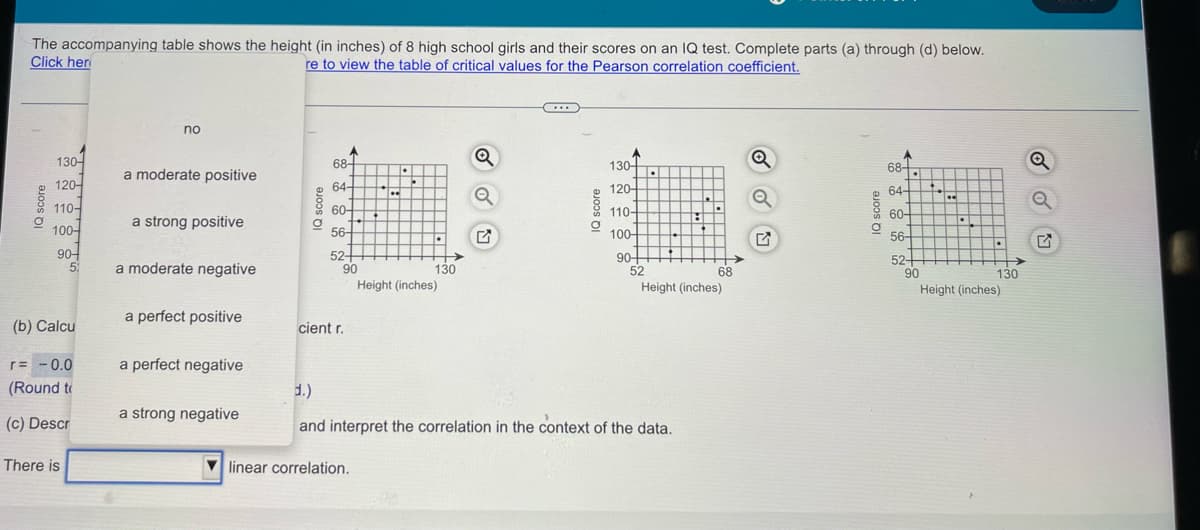
Transcribed Image Text:The accompanying table shows the height (in inches) of 8 high school girls and their scores on an IQ test. Complete parts (a) through (d) below.
Click her
re to view the table of critical values for the Pearson correlation coefficient.
no
130-
a moderate positive
68-
130-
681.
120-
64+
120-
64-
110-
60-
110-
60-
100-
a strong positive
56-
100-
56-
90
5:
52+
90
->
130
90-
52
Height (inches)
52+
90
a moderate negative
68
130
Height (inches)
Height (inches)
a perfect positive
(b) Calcu
cient r.
r= -0.0
a perfect negative
(Round to
d.)
a strong negative
(c) Descr
and interpret the correlation in the context of the data.
There is
V linear correlation.
IQ score
Expert Solution
This question has been solved!
Explore an expertly crafted, step-by-step solution for a thorough understanding of key concepts.

Step by step
Solved in 3 steps with 2 images

Recommended textbooks for you
Glencoe Algebra 1, Student Edition, 9780079039897…
Algebra
ISBN:
9780079039897
Author:
Carter
Publisher:
McGraw Hill
Glencoe Algebra 1, Student Edition, 9780079039897…
Algebra
ISBN:
9780079039897
Author:
Carter
Publisher:
McGraw Hill