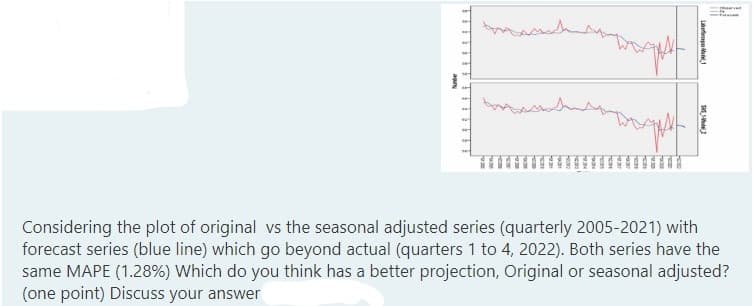
**** Labforps Made f 585-2 Considering the plot of original vs the seasonal adjusted series (quarterly 2005-2021) with forecast series (blue line) which go beyond actual (quarters 1 to 4, 2022). Both series have the same MAPE (1.28%) Which do you think has a better projection, Original or seasonal adjusted? (one point) Discuss your answer


Q: Which of these analysis helps find the "best fitting" equation for future predictions? Group of…
A: Given : State : Analysis helps find the "best fitting" equation for future predictions
Q: Let x = red blood cell (RBC) count in millions per cubic millimeter of whole blood. For healthy…
A: Hello. Since your question has multiple parts, we will solve first 3sub parts question for you. If…
Q: The table below shows a relative-frequency distribution for the heights of female students at a…
A: Relative Frequency Relative frequency is defined as the number of instances of a specific task…
Q: A missile guidance system has nine fail-safe components. The probability of each failing is 0.40.…
A:
Q: The results of a study showed that heterosexual women, during ovulation, were significantly better…
A: Given Population proportion=0.67 n=100
Q: Using the site. A writer for the school newspaper tests this claim by choosing a random sample of…
A: The hypothesized proportion is 0.38.
Q: 2. When you get ready to get dressed for school you open your closet to find that you haw the…
A: 2) The number of color shirts is 3.
Q: A simple random sample of 50 items from a population with ? = 8 resulted in a sample mean of 32.…
A: Solution-: Given: n=50,σ=8,x¯=32 We want to find, (a) A 90% confidence interval for the population…
Q: A fair coin is tossed three times, and the events A and B are defined as shown below. Complete…
A: Given that A fair coin is tossed three times, and the events A and B are defined as shown below.…
Q: The following table shows the mean number of colonies per plate obtainable by four slightly…
A:
Q: Perform the test of hypothesis on the following scenarios. A brand of powdered milk is advertised as…
A: The question is about hypo. testing for a popl. mean Given : Popl. mean of net weight of milk cans (…
Q: What is Standard Error, and what does it mean?
A: Standard error : It is the estimated standard deviation or the measure of variability in the…
Q: e added to reduce the error variance
A: Dependent Variable Independent variable wage experience The parabolic regression model will be…
Q: Determine whether the variable is qualitative or quantitative. Explain your reasoning. Color of car…
A: Solution-: Determine whether the variable is qualitative or quantitative. Color of car driven
Q: etch the graph that shows Z0.42 and then determine Zo.42- ick here to view page 1 of the normal…
A: The provided information is z0.42 The sketch for the value is option D
Q: The Indian River County Health Department needs to estimate the proportion of all children in the…
A: "Since you have posted a question with multiple sub-parts, we'll solve the first three sub-parts for…
Q: Assuming that the heights of college women are normally distributed with mean 68 inches and standard…
A: Given Mean=68 Standard deviation=3
Q: How is a sample related to a population? Choose the correct answer below. OA. A sample is a subset…
A:
Q: The median yearly salary for a police dispatcher in a large city was $44,528. If the 25th percentile…
A: a. The median yearly salary for a police dispatcher in a large city was $44528.
Q: Mulungushi University MPA/MIRD students have an average MPA/MIRD 802 test one score of 1,020. From a…
A: Given μ=Mulungushi University MPA/MIRD students have an average μ=802 σ= Standard deviation=144…
Q: Q2/ The following data represents the sales of a company Eligibility for the period 2010-2014 2010…
A: For finding predicted value: Step1: Firstly we have fitted a straight line Step2: Then by using…
Q: Find class boundaries, midpoint, and width for the class. 2.48-6.12
A: class boundaries, midpoint, and width for the class. 2.48-6.12
Q: Create an excel file Construct a sheet that lets the user input 20 numbers, a number X, and another…
A: Given Information: Consider the given dataset: Data Values 100 50.3 1432 5.67 11 1032…
Q: Use the frequency histogram to complete the following parts. (a) Determine the number of classes.…
A:
Q: The table summarizes results from 986 pedestrian deaths that were caused by automobile accidents.…
A:
Q: The standard mean constant of the composition is.
A: Given: E(w)=1000 And E(ln*w)=3600 Then to find standard mean constant composition?
Q: Each front tire on a particular type of vehicle is supposed to be filled to a pressure of 26 psi.…
A:
Q: Find the covariance and the correlation coefficient between X and Y, if X and Y are jointly discrete…
A: For the given data Find the covariance and correlation between x and y
Q: if three cards are drawn from a well shuffled 52 card deck of playing cards, Find the probability…
A:
Q: action=edit&resid=C08701F6876D7727!330&ithint=file%2cdocx&action=edit&wdNewAndOpenCt=1654742848849&w…
A:
Q: The effectiveness of a blood-pressure drug is being investigated. An experimenter finds that, on…
A: It is given that Sample mean = 70.9 Sample standard deviation = 5.4 Sample size = 28 Confidence…
Q: A group of people were asked if they had run a red light in the last year. 409 responded "yes", and…
A:
Q: score in a game of dice (a) A random variable X is defined as the larger of the scores obtained in…
A:
Q: In a survey of 2490.golfers, 22% said they were left-handed. The survey's margin of error was 4%.…
A: The confidence interval formula of population proportion is (p̂ ± E), where p̂ is the sample…
Q: You may need to use the appropriate appendix table or technology to answer this question. Consider…
A: Solution-: Given: n=500,p^=0.275 Hypothesis: H0:p=0.30 Vs H1:p≠0.30 (Two tailed)…
Q: The mean useful life of car batteries is 54 months. They have a standard deviation of 6. Assume the…
A:
Q: A correlation of r = – 0.95 is stronger than r = + 0.70.
A: Given that correlation r=-0.95 and r=0.70
Q: a) State whether the following are true or false. i) In an LP problem, at least one corner point…
A: Since you have posted a question with multiple subparts, we will solve first three subparts for you.…
Q: The lengths and weights of a zoo's pygmy shrews were recorded during their annual Length (mm) 95 81…
A: The given data is x y 95 5.4 83 4.5 91 5 82 1.1 75 3.7 62 2.6 79 4.5 63 3.1 81…
Q: Below is a graph of a normal distribution with mean μ=-2 and standard deviation o=3. The shaded…
A: The provided information is µ=-2 σ=3 P(X>1) P(X-µσ>1-(-2)3)P(z>1)=0.1586 (from…
Q: hed images. The tables show the results from a paired t-test between males and females in each…
A: Prevalence of Obesity Continent t df p-value Females = Males Europe 0.6832 39 0.4985…
Q: You are interested in finding a 95% confidence interval for the average commute that non-…
A: Given data is: 8 8 28 7 22 13 24 8 24 8 24 Total number of students =11 a) as sample size is…
Q: A car insurance company tells its prospective customers that they can save an average of at least…
A:
Q: The following data show the brand, price (S), and the overall score for six stereo headphones that…
A: Solution: Given information: The estimated regression equation is y^=23.2437+0.3176x
Q: your a According to a study, brain weights of men in country A are normally distributed with mean…
A:
Q: We know P(A) = 0.2. a) Find and interpret the odds against event A occurring. b) Find and interpret…
A: We have given that, The chance of happening of event A is PA=0.2
Q: A normal probability plot of data from a sample of a population is shown to the right. Assess the…
A: A normal probability plot is given for a sample data, the objective is to assess the normality of…
Q: Let X denote the amount of time a book on two-hour reserve is actually checked out, and suppose the…
A: Since we only answer up to 3 sub-parts, we’ll answer the first 3. Please resubmit the question and…
Q: Find the S.D of the following data: 1216, 1374, 1167, 1232, 1407, 1453, 1202, 1372, 1278, 1141,…
A: Given data is 1216, 1374, 1167, 1232, 1407, 1453, 1202, 1372, 1278, 1141, 1221, 1329
Q: For the following conjecture, state the null and alternative hypotheses. The average age of…
A:

Step by step
Solved in 2 steps

- An article in Quality Engineering presents viscosity data from a batch chemical process. A sample of these data is in the table. Reading left to right and up to down, draw a time series plot of all the data and comment on any features of the data that are revealed by this plot. Consider that the first 40 observations (the first 4 columns) were generated from a specific process, whereas the last 40 observations were generated from a different process. Does the plot indicate that the two processes generate similar results? Calculate the sample mean and sample variance of the first 40 and the second 40 observations.Alternating series test Coverages or diverges?Which of the following is a DISADVANTAGE of using a moving average technique todetermine time series trend?A.The trend values obtained do not reflect thegeneral trend.B.Only one trend value can be obtained foreither of the end points of the series.C.No trend values are obtained for thebeginning and end time points of the series.D.Each moving average trend value obtaineddoes not correspond with a time point
- Case study or time seriesA university is considering setting up an information desk manned by one employee. Based on information obtained from similar information desks, it is believed that people will arrive at the desk at the rate of 18 per hour. It takes an average of 2 minutes to answer a question. It is assumed that arrivals are Poisson and answer times are exponentially distributed. What is the arrival rate? (Include the units.) What is the service rate? (Include the units.) Find the probability that the employee is idle.choices: a. true b. false c. others (specify) 1. For stationary to attained, the data should undergone differencing so that the variance can be stabilize. 2. The series is called a white noise series if the forecast errors or residuals has no visible pattern 3. White noise models are widely used for non-stationary data.
- Question ( The length of adult male dolphins is normally distributed with an unknown mean μ. By some previous knowledge, the population standard deviation, is considered as known and is given by σ=1m. We took a sample of n=16 adult male dolphins, finding the sample mean x¯=7.6 meters. What is the distribution of the proper test statistic for doing inference for the population mean μ? Choose one No answer given Binomial distribution Normal distribution Student’s distribution Poisson distribution.The age of children in kindergarten on the first day of school is uniformly distributed between 4.88 and 5.94 years old. A first time kindergarten child is selected at random. Round answers to 4 decimal places if possible. If such a child is at the 87th percentile, how old is that child? ____ years old.You're curious what the average age of people on your flight is. Age is Normally distributed. You take a quick look around at 6 people, and estimate that the average age is 43 years, and the sample stdev is 5 yrs. What is the margin of error for a 95% CI for the mean? (Leave your answer to two decimal places.)
- EmergencyRoomTraffic. Desert Samaritan Hospital in Mesa, Arizona, keeps records of emergency room traffic. Those records reveal that the times between arriving patients have a special type of reverse-J-shaped distribution called an exponential distribution. They also indicate that the mean time between arriving patients is 8.7 minutes, as is the standard deviation. Suppose that you observe a sample of 10 interarrival times. a. Theoretically, what are the mean and standard deviation of all possible sample means? b. Use the technology of your choice to simulate 1000 samples of 10 interarrival times each. c. Determine the mean of each of the 1000 samples you obtained in part (b). d. Roughly what would you expect the mean and standard deviation of the 1000 sample means you obtained in part (c) to be? Explain your answers. e. Determine the mean and standard deviation of the 1000 sample means you obtained in part (c). f. Compare your answers in parts (d) and (e). Why are they different?The Age of Disposability. Suppose that the life of a certain device is approximately normally distributed with mean 48 months and standard deviation 16 months. You must use the product for 2 years. If it fails in that period, your cost will be $1000. If it does not fail, your cost will be $500. Type calculations/explanations in answering all these questions: a) What proportion of these devices are expected to fail during the 2-year use period? b) What is your expected cost of using this device for the 2 years? c) Approximately, what would be a fair price for a warranty against failure in the 2-year period?A tubes lifetime for your company's microwave follow an exponential distribution with a mean of 5.6 years. Your sales policy states that each magnetron tube has a two year warranty. What fraction of the tubes should your company plan to replace under warranty?