ler a fictional price index, the College Student Price Index (CSPI), based on a typical college student's annual purchases. Suppose the following shows information on the market basket for the CSPI and the prices of each of the goods in 2017, 2018, and 2019. ost of each item in the basket and the total cost of the basket are shown for 2017. rm these same calculations for 2018 and 2019, and enter the results in the following table. 2017 2018 2019 Price Cost Price Cost Price Cost Quantity in Basket (Dollars) (Dollars) (Dollars) (Dollars) (Dollars) (Dollars) tebooks 16 4 Iculators 1. 64 64 104 134 rge coffees 150 2. 300 2 sergy drinks 40 3 120 4 extbooks 10 80 800 85 105 otal cost 1,300 rice index 100 opose the base year for this price index is 2017. the last row of the table, calculate and enter the value of the CSPI for the remaining years. tween 2017 and 2018, the CSPI increased by . Between 2018 and 2019, the CSPI increased by
ler a fictional price index, the College Student Price Index (CSPI), based on a typical college student's annual purchases. Suppose the following shows information on the market basket for the CSPI and the prices of each of the goods in 2017, 2018, and 2019. ost of each item in the basket and the total cost of the basket are shown for 2017. rm these same calculations for 2018 and 2019, and enter the results in the following table. 2017 2018 2019 Price Cost Price Cost Price Cost Quantity in Basket (Dollars) (Dollars) (Dollars) (Dollars) (Dollars) (Dollars) tebooks 16 4 Iculators 1. 64 64 104 134 rge coffees 150 2. 300 2 sergy drinks 40 3 120 4 extbooks 10 80 800 85 105 otal cost 1,300 rice index 100 opose the base year for this price index is 2017. the last row of the table, calculate and enter the value of the CSPI for the remaining years. tween 2017 and 2018, the CSPI increased by . Between 2018 and 2019, the CSPI increased by

Chapter13: Inflation
Section: Chapter Questions
Problem 19SQ

Related questions
Question
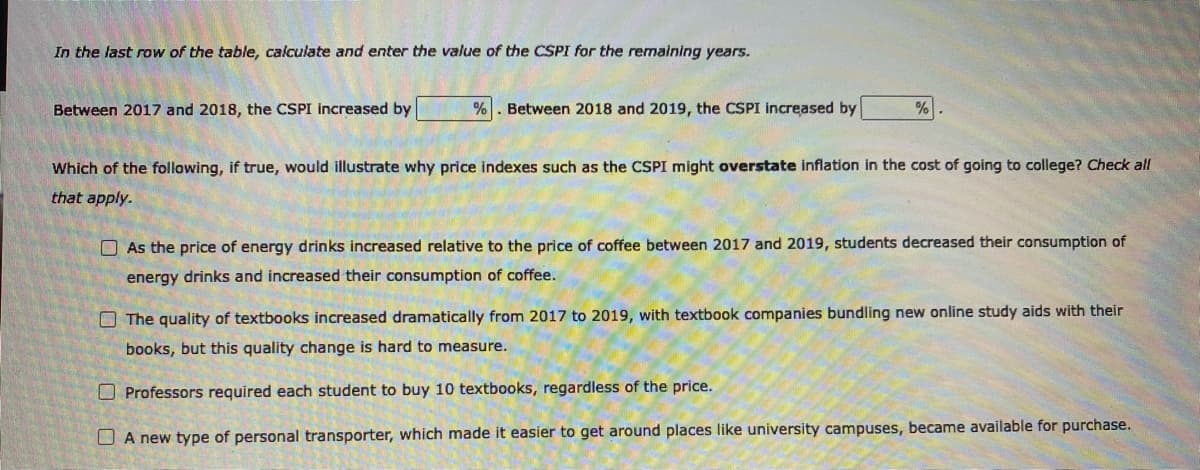
Transcribed Image Text:In the last row of the table, calculate and enter the value of the CSPI for the remaining years.
Between 2017 and 2018, the CSPI increased by
Between 2018 and 2019, the CSPI increased by
Which of the following, if true, would illustrate why price indexes such as the CSPI might overstate inflation in the cost of going to college? Check all
that apply.
O As the price of energy drinks increased relative to the price of coffee between 2017 and 2019, students decreased their consumption of
energy drinks and increased their consumption of coffee.
O The quality of textbooks increased dramatically from 2017 to 2019, with textbook companies bundling new online study aids with their
books, but this quality change is hard to measure.
O Professors required each student to buy 10 textbooks, regardless of the price.
O A new type of personal transporter, which made it easier to get around places like university campuses, became available for purchase.
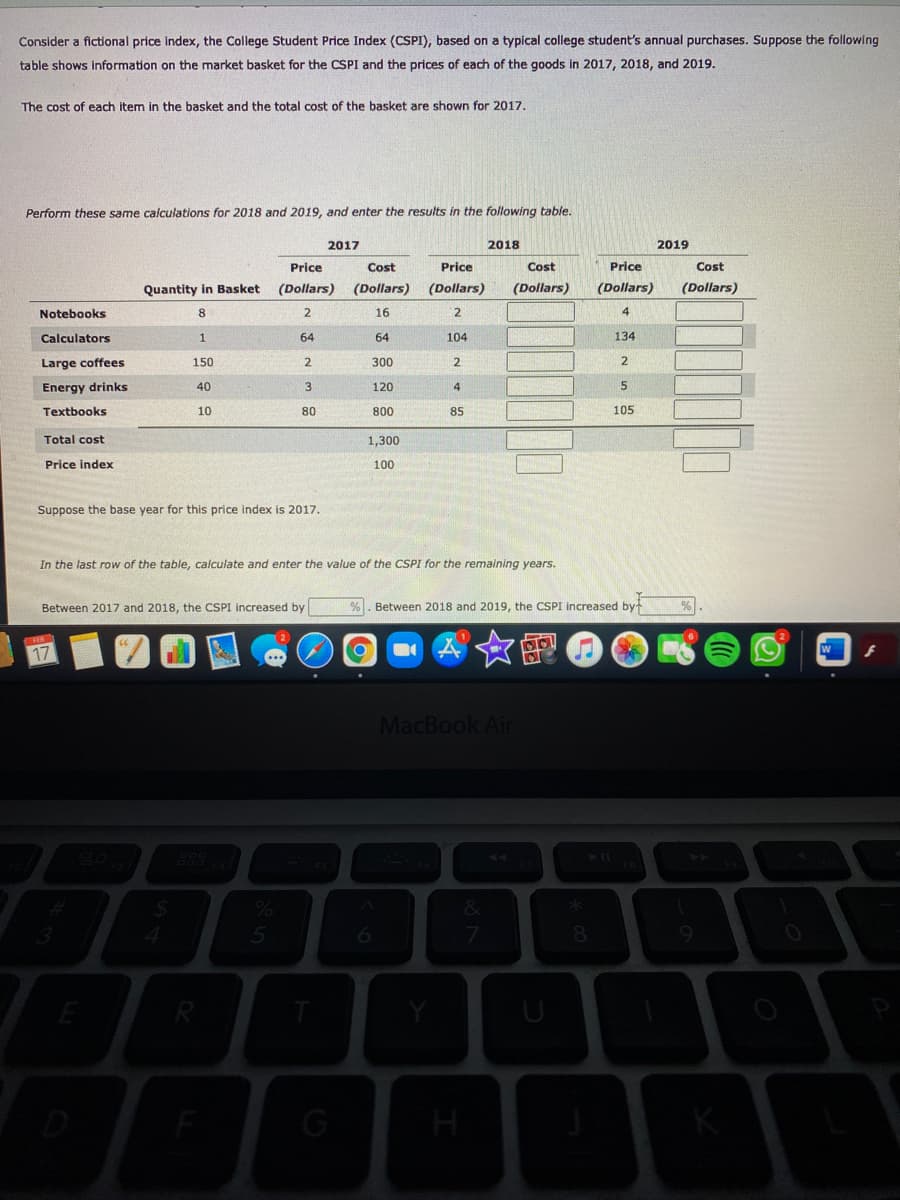
Transcribed Image Text:Consider a fictional price index, the College Student Price Index (CSPI), based on a typical college student's annual purchases. Suppose the following
table shows information on the market basket for the CSPI and the prices of each of the goods in 2017, 2018, and 2019.
The cost of each item in the basket and the total cost of the basket are shown for 2017.
Perform these same calculations for 2018 and 2019, and enter the results in the following table.
2017
2018
2019
Price
Cost
Price
Cost
Price
Cost
Quantity in Basket
(Dollars)
(Dollars)
(Dollars)
(Dollars)
(Dollars)
(Dollars)
Notebooks
8
2
16
4
Calculators
64
64
104
134
Large coffees
150
2.
300
2.
Energy drinks
40
120
4
Textbooks
10
80
800
85
105
Total cost
1,300
Price index
100
Suppose the base year for this price index is 2017.
In the last row of the table, calculate and enter the value of the CSPI for the remaining years.
Between 2017 and 2018, the CSPI increased by
%. Between 2018 and 2019, the CSPI increased by
对女图
17
MacBook Air
%
E
U
G
H
Expert Solution
This question has been solved!
Explore an expertly crafted, step-by-step solution for a thorough understanding of key concepts.

This is a popular solution!

Trending now
This is a popular solution!

Step by step
Solved in 3 steps with 1 images

Knowledge Booster


Learn more about
Need a deep-dive on the concept behind this application? Look no further. Learn more about this topic, economics and related others by exploring similar questions and additional content below.Recommended textbooks for you

