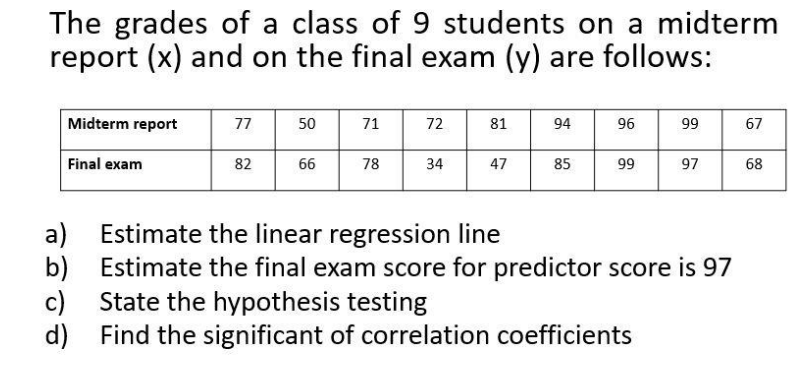
<) and on the final exam (y) are follows: rt 77 82 50 66 71 78 72 34 81 47 94 85 96 99 99 97 ate the linear regression line ate the final exam score for predictor score is 97 the hypothesis testing 67 68


Q: nly given a column vector function (2x1), f(B) = [e^(B1) - 1 ; e^(B2) - 1], then how do you find…
A: To find the asymptotic variance-covariance matrix estimator using the Delta method, we need to…
Q: For a certain type of computers, the length of time between charges of the battery is normally…
A: Answer The mean =50Standard deviation =15
Q: Several years ago, researchers conducted a study to determine whether the "accepted" value for…
A: It is given that:
Q: Please answer number 9. All steps!! Make sure to show work!! Answer quickly!
A: 9.Each of the given data sets has
Q: In a study of 816 randomly selected medical malpractice lawsuits, it was found that 500 of them were…
A: Sample size n =816Favorable cases x =500significance level()=0.01Sample proportion()==0.6127
Q: Match these values of r with the accompanying scatterplots: 1, -0.997, 0.364,-1, and -0.721. Click…
A: Scatter plot:A Scatterplot displays the relationship between 2 numeric variables. Each dot…
Q: 12. Critical Thinking Consider the following types of data that were obtained from a random sample…
A:
Q: Based on a survey, assume that 34% of consumers are comfortable having drones deliver their…
A: The probability of consumers being comfortable having drones is 0.34.
Q: Step 2 of 2 : Find the standard deviation of the number of education majors in the sample. Round…
A: Given that n = 30 , N = 150 , K = 50 30 freshman are randomly selected (without replacement). So we…
Q: a. Verify that the function given is a valid probability density function. b. Determine the…
A: According to the Bartleby guidelines expert solve only one question and maximum three subpart of the…
Q: Consider the following probability density function of the random variable X: fx (2:0) = -√e-12-01…
A: Given the probability density function of the random variable X:,
Q: The equation in the form 2-od" is 2-x (Round to four decimal places as needed.)
A: Given,The nonlinear sample regression equation is,wherewe know that,l.e the total number of pairs…
Q: what percent of the students scored higher than 68?
A: It is given thatMean, μ = 70Standard deviation, σ = 3Z-Score, Z = ( X - μ )/σwhere, Z be the…
Q: The weights of 5 squash (in pounds) are 10, 17, 17.5, 18.5, and 19.5. The sample weights have a mean…
A:
Q: Stay in school: In a recent school year in the state of Washington, there were 316,000 high school…
A: There were 316000 high school students.Among the girls, 48300 dropped out of school.Among the boys,…
Q: Carlos and Devon both accepted new jobs at different companies. Carlos's starting salary is $36,000…
A: Carlos's starting salary is $36000Devon's starting salary is $33000Carlos's company offers…
Q: Find the indicated IQ score. The graph to the right depicts IQ scores of adults, and those scores…
A: From the provided information,Mean (µ) = 100Standard deviation (σ) = 15X~N (100, 15)
Q: 1. What is the class width for a frequency distribution with 7 classes? 2. Find the class…
A: The size or width of each class interval in a statistical frequency distribution or histogram is…
Q: o perform a certain type of blood analysis, lab technicians must perform two procedures. The first…
A: From the given information , Here , two procedures must be done.First procedure can be completed in…
Q: The table below shows the weights of seven subjects before and after following a particular diet for…
A: The data for the weight of seven subjects before and after a particular diet is given.
Q: You wish to test the following claim (Ha) at a significance level of a = 0.02. d denotes the mean of…
A: The question is about paired t testGiven :To find :a ) Test statb ) p valuec ) Comparing p value…
Q: Find P(A | B) when P(A) = 0.8, P(A M B) = 0.1, and the two events A and B are exhaustive.
A: For the two events and , it is given that: ; .The events and are exhaustive.
Q: Consider the data that was obtained from a random sample of 51 credit card accounts. Identify all…
A: Sample size,
Q: How many computers? In a simple random sample of 170 households, the sample mean number of personal…
A: It is given that the sample mean is 1.64 and the population standard deviation is 0.26.
Q: Based on the data shown below, calculate the correlation coefficient (to three decimal places) x y…
A: From the given table we make the following table for the calculation of correlation coefficient…
Q: Which of the pairs of events below is dependent? Select the correct answer below: drawing a 2 and…
A: The dependent events are those events whose outcome depends on one another.
Q: The poverty rates for white and blacks in the U.S were compared for a period of twelve years with…
A: WhiteBlack9.130.99.732.49.6338.830.8828.96.927.86.927.5728.27.127.97.727.16.826.9727.8
Q: Paired t-Test In the last few years, a number of web-based companies that offer job-placement…
A: FinanceMarketing780007500085000790007500079000780007600074000790007900076000860008000084000710007600…
Q: "Trydint" bubble-gum company claims that 9 out of 10 people prefer their gum to "Eklypse". Test…
A: Hello! Thanks for the question. We are answering the first 3 sub parts in the case of multiple…
Q: Construct a Venn diagram to represent your assigned problem. Include capital letter labels for all…
A: A survey of outdoor recreation enthusiasts had 5,238 responses.Group 1: responders who are…
Q: Find mode for variable "Favorite Sports using the graph below. Our Favorite Sports Number of…
A: Mode:A mode is defined as the value that has a higher frequency in a given set of values. It is the…
Q: born with Genetic Condition B is �=19/20. A study looks at a random sample of 901 volunteers. Find…
A: To find the most likely number of the 901 volunteers to have Genetic Condition B, we can multiply…
Q: Today, the waves are crashing onto the beach every 5.1 seconds. The times from when a person arrives…
A: As per our guidelines we are suppose to answer only three sub parts kindly post the remaining sub…
Q: If 14 out of 25 people buy from Amanda, and 11 out of 25 buy from Mikey. How likely is it that…
A: The likelihood or chance of a specific event or outcome occurring is termed 'probability'. It is a…
Q: A data set includes data from student evaluations of courses. The summary statistics are n = 85,…
A: Population mean = ? = 3.5Sample S.D = s =0.61Sample size = n =85Sample mean = x̅ = 3.41
Q: 15. Interpretation A job-performance evaluation form has these categories: 1 = excellent; 2 = good;…
A: The job-performance categories are as follows:1 is excellent, 2 is good, 3 is satisfactory, 4 is…
Q: Lottery: Every day, Jorge buys a lottery ticket. Each ticket has a probability of 0.2 of winning a…
A: n=7, p=0.2X~Binomial(n=7, p=0.2)Let X be the number of winning prizes ticketsp be the probability of…
Q: Problem: As a data analyst, you could use multiple linear regression to predict crop growth. You…
A: We need to perform the multiple regression analysis on the given problem. n= 20 observation k=…
Q: Fill in the blank. A is a procedure for testing a claim about a property of a population.
A: To fill in the blank for the above statement.
Q: se the accompanying 200 Los Angeles commute times to test the claim that the sample is fr andard…
A: Sample size n =200Population standard deviation =24
Q: Midterm grades are determined partly by time spent studying and partly by efficiency of studying…
A: We can assume that both studying time and efficiency have positive correlation with mid-term grades…
Q: A pickle producer currently purchases lids for its jars from a certain manufacturing company. The…
A:
Q: a. Mean b. Median c. Mode d. Midrange e. Range f. Variance g. Standard deviation
A: The data is given on the no. of elementary and secondary schools for selected states.Sample size (n)…
Q: Using proper notation, write the null and alternative hypothesis statements.
A: Given that: k= 3 groups or treatments Each group has 7 observation n= 3*7= 21 Total observation…
Q: 24. A customer service representative must spend different amounts of time with each customer to…
A: A random variable XExp(0.2)f(x)=f(x)=0.2 ; x0and Cumulative distribution function(CDF)…
Q: Managers rate employees according to job performance and attitude. The results for several randomly…
A: xy1035967669831033435497
Q: A person is said to have hypertension stage 1 if their blood pressure is between 130 and 139. Find…
A: The question is about normal dist.Given :Popl. mean blood pressure ( ) = 120.8 mmHGPopl. std.…
Q: Coefficients Standard Error Intercept 0.72 0.9 0.12 -0.15 -0.15 cpi-1 cpi-2 cpi-3 cpi-4 0.21 0.13…
A: Given the estimated regression model output as
Q: The graph below shows the number of students at Collins Middle School enrolled in Spanish classes…
A: The objective is to identify the correct statement based on the bar graph. The height of each bar…
Q: Suppose you want to estimate the effect of access to public transportation on house prices. You…
A:

Step by step
Solved in 5 steps with 5 images

- A random sample of twelve students were chosen, and their midterm test score (y), as- signment score (x1), and missed classes (x2) were recorded as follows: Midterm Score, y Assignment Score, x1 Classes Missed, x2 85 74 76 90 85 87 94 98 81 91 76 74 65 50 55 65 55 70 65 70 55 70 50 55 5 7 5 2 6 3 2 5 4 3 1 4 (i) What is the fitted multiple linear regression equation of the form yˆ = b0 + b1x1 + b2x2? (ii) From part (i) above, estimate the midterm test score grade for a student who has an assignment score of 60 and missed 4 classes.In order to determine the relationship between the number of units sold of a company's product (yy) in 8 cities with their major competitor's price (x1x1) in dollars, and the number of stores (x2x2) the competitor has in each city, the following data were collected. Units sold CompetitorPrice CompetitorStores 545 35 3 550 35 3 590 40 2 570 39 4 540 40 5 600 40 2 575 46 6 560 39 3 Generate a linear multiple regression output for the data.Interpret the estimated regression coefficient corresponding to the Z variable. Data Salary Education Experience Sex 29.7985 15 3 1 21.8219 4 0 0 22.8978 4 0 0 22.0917 1 1 0 21.8993 5 0 0 22.4829 3 1 1 28.0772 15 0 0 y=salary 23.6292 6 1 1 x1=education level in schooling years 32.3595 0 15 1 x2=experience level in employment level 21.794 1 0 0 d=sex (1 for male,0 for female) 19.8762 3 0 0 Ln(Y) = alpha +beta1X1 +Beta2X2+ Beta3D +Beta4Z +e 21.0253 3 0 0 where z =X2D 24.6323 0 5 1 19.0247 0 0 0 18.8857 0 0 0 21.8552 1 0 0 24.2675 6 1 0 18.7931 0 0 0 18.9276 0 0 0 23.4441 5 1 1 20.8047 2 0 0 18.26 0 0 0 20.6726 0 2 1 21.7815 3 0 0…
- The table below shows the numbers of new-vehicle sales (in thousands) for Company 1 and Company 2 for 11 years. Construct and interpret a 99% prediction interval for new-vehicle sales for Company 2 when the number of new vehicles sold by Company 1 is 2600 thousand. The equation of the regression line is y=1.228x+331.966 Company_1,_x Company_2,_y4093 49293976 48203557 48003411 47323296 46193102 44872859 40482488 38091970 29191625 20021946 2176 Construct and interpret a 99% prediction interval for new-vehicle sales for Company 2 when the number of new vehicles sold by Company 1 is 2600 thousand. Select the correct choice below and fill in the answer boxes to complete your choice. (Round to the nearest cent as needed.) A. There is a 99% chance that the predicted new-vehicle sales for Company 2 is between enter your response here and enter your response here thousand, given that the new-vehicle sales for Company 1 is 2600 thousand.…The table below shows the numbers of new-vehicle sales (in thousands) for Company 1 and Company 2 for 11 years. Construct and interpret a 99% prediction interval for new-vehicle sales for Company 2 when the number of new vehicles sold by Company 1 is 2600 thousand. The equation of the regression line is y=1.228x+331.966 Company_1,_x Company_2,_y4093 49293976 48203557 48003411 47323296 46193102 44872859 40482488 38091970 29191625 20021946 2176In order to determine the relationship between the number of units sold of a company's product (yy) in 9 cities with their major competitor's price (x1x1) in dollars, and the number of stores (x2x2) the competitor has in each city, the following data were collected. Units sold CompetitorPrice CompetitorStores 510 35 5 600 44 3 600 41 2 600 40 2 650 45 1 590 40 2 600 41 1 540 40 5 590 40 2 Generate a linear multiple regression output for the data.a) Report the regression coefficients accurate to 3 decimal places:ˆyy^= + x1 + x2b) Report the coefficient of determination accurate to 3 decimal places:R2=
- Using 25 observations on each variable, a computer program generated the following multiple regression model: yhat=69.2+2.87x1+5.81x21.83x3 If the standard errors of the coefficients of the independent variables are, respectively, 1.34, 4.84, and 0.70, can you conclude that the independent variable x1 is needed in the regression model? Let β1, β2, and β3 denote the coefficients of the 3 variables in this model, and use a two-sided hypothesis test and significance level of 0.05 to determine your answer. Carry your intermediate computations to at least three decimal places and round your answers as specified in the table. The null hypothesis: H0: The alternative hypothesis: H1: The type of test statistic: (Choose one)ZtChi squareF The value of the test statistic:(Round to at least two decimal places.) The two critical values at the 0.05 level of significance:(Round to at least two decimal places.) and Can you…The following table displays the mathematics test scores for a random sample ofcollege students, along with their final SY16C grades.a. Fit the regression line y=a+bx to the data and interpret the results.b. Use the regression equation to determine the SY16C grade for a college student whoscored 60 on their achievement test. What would their SY16C gradebe? Mathematics test(x) SY16C grades(y)1 39 652 43 783 21 524 64 825 57 926 47 897 28 738 75…Years of Work Experience and number of Job Offers of 10 job-seekers were as follows: Work Exp. 4 2 5 3 7 12 2 5 4 9 No. of Offers 7 1 8 4 13 19 3 11 9 15 a. Fit the regression equation of No. of Job Offers on Years of Work Experience. b. What will be the predicted number of offers for an applicant with 6 years of experience? c. Verify the relationship between the number of job offers and years of work experience using at least two relevant methods
- A seafood-sales manager collected data on the maximum daily temperature, T, and the daily revenue from salmon sales, R, using sales receipts for 30 days selected at random. Using the data, the manager conducted a regression analysis and found the least-squares regression line to be Rˆ=126+2.37T. A hypothesis test was conducted to investigate whether there is a linear relationship between maximum daily temperature and the daily revenue from salmon sales. The standard error for the slope of the regression line is SEb1=0.65. Assuming the conditions for inference have been met, which of the following is closest to the value of the test statistic for the hypothesis test? t=0.274 A t=0.65 B t=1.54 C t=3.65 D t=193.85 EA researcher collected data on the cholesterol level, CC, and the age, AA, of 24 people selected at random. Using the data, the researcher calculated the least-squares regression line to be Cˆ=182+2.2AC^=182+2.2A and the standard error of the slope to be 0.38. If the conditions for inference are met, which of the following is closest to the value of the test statistic to test the hypotheses H0:β=0H0:β=0 versus Ha:β≠0Ha:β≠0 ?The number of initial public offerings of stock issued in a 10-year period and the total proceeds of these offerings (in millions) are shown in the table. Construct and interpret a 95% prediction interval for the proceeds when the number of issues is 646. The equation of the regression line is y=32.824x+17,659.242. Issues, x 418 475 683 477 492 379 59 51 196 154 Proceeds, y 17,703 28,601 43,966 31,686 36,833 36,916 21,908 10,311 31,407 28,337 Construct and interpret a 95% prediction interval for the proceeds when the number of issues is 646. Select the correct choice below and fill in the answer boxes to complete your choice. (Round to the nearest million dollars as needed. Type your answer in standard form where "3.12 million" means 3,120,000.) A. We can be 95% confident that when there are 646 issues, the proceeds will be between $____ and $____. B. There is a 95% chance…


