
MATLAB: An Introduction with Applications
6th Edition
ISBN: 9781119256830
Author: Amos Gilat
Publisher: John Wiley & Sons Inc
expand_more
expand_more
format_list_bulleted
Concept explainers
Question

Transcribed Image Text:
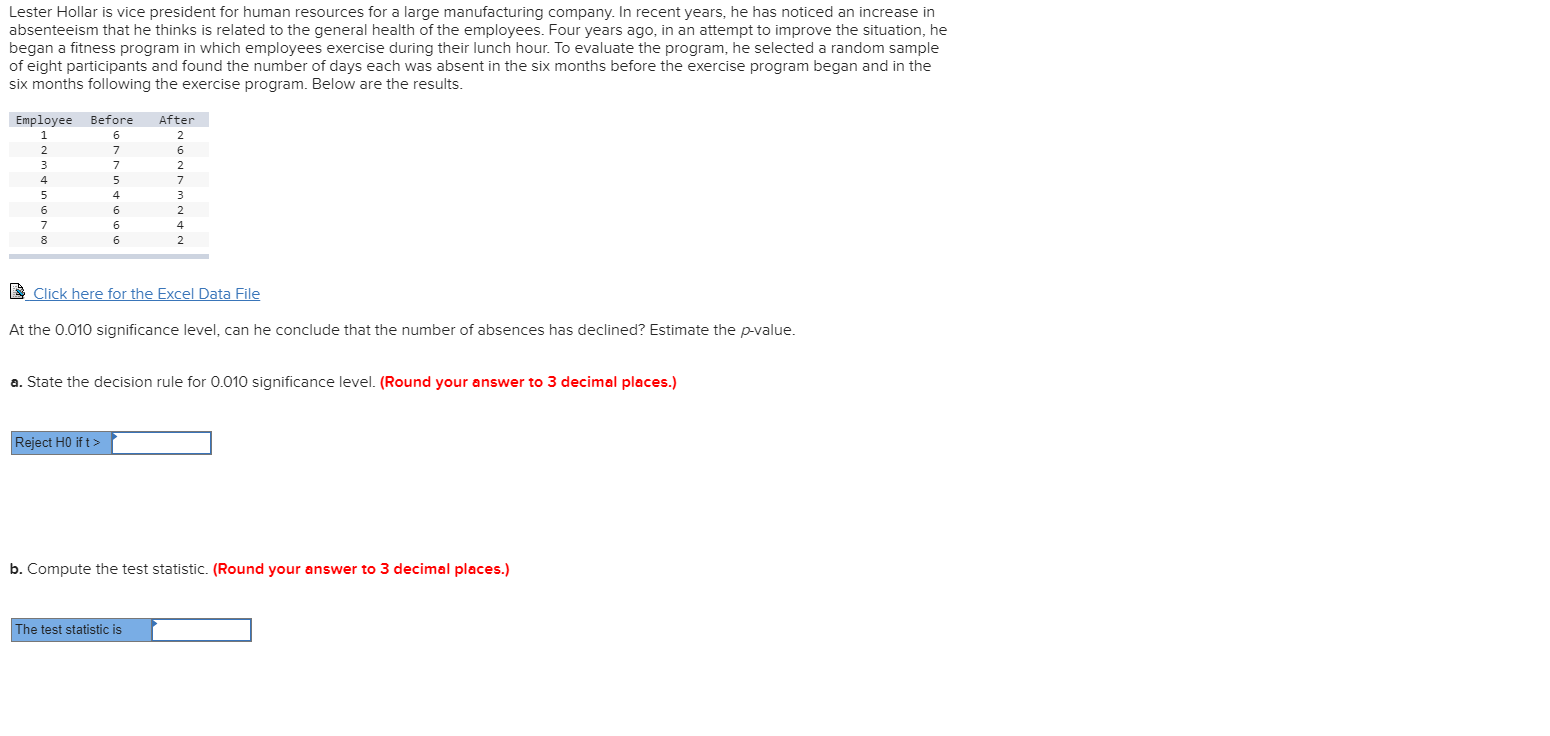
Lester Hollar is vice president for human resources for a large manufacturing company. In recent years, he has noticed an increase in
absenteeism that he thinks is related to the general health of the employees. Four years ago, in an attempt to improve the situation, he
began a fitness program in which employees exercise during their lunch hour. To evaluate the program, he selected a random sample
of eight participants and found the number of days each was absent in the six months before the exercise program began and in the
six months following the exercise program. Below are the results.
Employee Before
After
1
6
2
2
7
6
7
2
5
7
5
4
3
6
6
2
7
6
4
6
2
Click here for the Excel Data File
At the 0.010 significance level, can he conclude that the number of absences has declined? Estimate the p-value.
a. State the decision rule for 0.010 significance level. (Round your answer to 3 decimal places.)
Reject HO if t>
b. Compute the test statistic. (Round your answer to 3 decimal places.)
The test statistic is

Expert Solution

This question has been solved!
Explore an expertly crafted, step-by-step solution for a thorough understanding of key concepts.
This is a popular solution
Trending nowThis is a popular solution!
Step by stepSolved in 5 steps with 5 images

Knowledge Booster
Learn more about
Need a deep-dive on the concept behind this application? Look no further. Learn more about this topic, statistics and related others by exploring similar questions and additional content below.Similar questions
- A auto shop wants to examine the proportion of customers that have to return after an appointment. Last year, an examination of 264 customers found that 30.1% had to return after an appointment. You instituted some changes at the auto shop this year, and found from a sample of 326 customers that 22.4% had to return after an appointment. You want to conduct an analysis to determine if there has been an increase in the proportion of customers that need to return after an appointment since the past year, with a = 0. 10. Using this information, what is the critical value of your analysis? Round your final answer to two decimal places. 2.11 1.96 2.33 1.28 1.64arrow_forwardYou are a sales manager for a grocery store, and you want to see if the introduction of a new sales promotion will increase the sales in your store. To do so, you decided to create an experiment by giving a small sample of customers the promotion before expanding it to a larger customer base. You gave 18 people the promotion, and also observed the sales of 27 people who did not get the promotion as a control group. You found those who received the promotion to have an average monthly sales of $456.60, with a sample standard deviation of $52.23. You found those who did not receive the promotion had an average monthly sales of $361.46, with a sample standard deviation of $56.11. Suppose you want to use hypothesis testing (two-sample test) to investigate if the promotion has increased the sales of your store. Using the order promotion no promotion in your hypothesis test, what is the value of the test statistic for your analysis? Note: 1- Only round your final answer. Round your final…arrow_forwardA. Headache Pain : There are many over-the-counter pain relievers. By the end of the semester, you have a tremendous headache and are looking for the most effective pain relief available. You conduct a study comparing the three most popular pain relievers and a placebo to see which work best. You use only subjects with headaches and record the amount of time (in minutes) it takes for their headache to go away after they receive the medication. You randomly assign 60 participants to one of the four conditions using a double- + blind procedure. (Use a = Placebo 70 Drug A 30 Drug B 10 Drug C 10 30 60 40 20 50 40 10 10 60 30 40 10 10 40 30 30 30 30 30 10 40 20 20 20 60 40 20 30 50 30 30 10 30 30 20 20 60 20 10 10 20 40 20 30 20 50 20 10 40 20 30 30 State the hypotheses Critical value and df Test statisticarrow_forward
- A. Headache Pain : There are many over-the-counter pain relievers. By the end of the semester, you have a tremendous headache and are looking for the most effective pain relief available. You conduct a study comparing the three most popular pain relievers and a placebo to see which work best. You use only subjects with headaches and record the amount of time (in minutes) it takes for their headache to go away after they receive the medication. You randomly assign 60 participants to one of the four conditions using a double- blind procedure. (Use a = .05) Drug A Drug C 10 Placebo Drug B 10 70 30 30 60 40 20 50 40 10 10 60 30 10 10 40 40 30 30 30 30 30 10 40 20 20 20 60 40 20 30 50 30 30 10 30 30 20 20 60 20 10 10 20 40 30 20 50 20 20 10 40 20 30 30 IV (or predictor) variable DV (or criterion) variable What type of analysis should you conduct to determine which method relieves headache pain most swiftly?arrow_forwardThe authors of a paper randomly selected two samples of patients admitted to the hospital after suffering a stroke. One sample was selected from patients who received biofeedback weight training for 8 weeks, and the other sample was selected from patients who did not receive this training. At the end of 8 weeks, the time it took (in seconds) to stand from a sitting position and then to sit down again (called sit-stand-sit time) was measured for the people in each sample. Data consistent with summary quantities given in the paper are given below. For purposes of this exercise, you can assume that the samples are representative of the population of stroke patients who receive the biofeedback training and the population of stroke patients who do not receive this training. Biofeedback Group 2.1 2.8 4.5 2.3 2.9 4.3 3.4 4.2 3.4 3.7 3.0 3.7 3.7 2.5 3.3 No Biofeedback Group 5.2 4.8 4.0 4.3 4.8 4.4 4.3 5.2 3.5 4.3 5.2 4.5 4.1 3.5 4.0 Conduct a test of hypothesis to test whether…arrow_forwardA health insurance company is looking at the use of its benefits by its members. It randomly selects 500 members for further study, and one of the pieces of information they collect is the amount the amount of money spent on prescription medications over the past year. The average amount among the 500 members is $600 and the SD is $1,000. A histogram of the amounts is quite skewed to the right, and 40 (8%) of the sampled members have spent $5000 or more on prescription medications in the past year. Calculate a 95%-confidence interval for the percentage of all members who have spent $5000 or more on prescription medications in the last year.arrow_forward
- The authors of a paper randomly selected two samples of patients admitted to the hospital after suffering a stroke. One sample was selected from patients who received biofeedback weight training for 8 weeks, and the other sample was selected from patients who did not receive this training. At the end of 8 weeks, the time it took (in seconds) to stand from a sitting position and then to sit down again (called sit-stand-sit time) was measured for the people in each sample. Data consistent with summary quantities given in the paper are given below. For purposes of this exercise, you can assume that the samples are representative of the population of stroke patients who receive the biofeedback training and the population of stroke patients who do not receive this training. Biofeedback Group 2.2 2.9 4.6 2.4 3.0 4.4 3.5 4.3 3.5 3.8 3.1 3.8 3.8 2.6 3.4 No Biofeedback Group 5.2 4.8 4.0 4.3 4.8 4.4 4.3 5.2 3.5 4.3 5.2 4.5 4.1 3.5 4.0 Conduct a test of hypothesis to test whether…arrow_forwardA child psychologist believe that controlled physical outbursts of anger (like punching a pillow) may improve the mood of young boys with emotional impairment. He believes that the proportion of boys who benefit from the treatment is greater than the proportion of girls. A random sample from each population receives counseling in the treatment and is asked about their mood after an episode (x is the number of test subjects that reported an improvement in mood). The results of the study are summarized in the table below. Boys n1 = 200 Girls n2 = 210 %3D %3D X1 = 35 X2 = 28 Blank #1: Find the two sample proportions, reporting each as a decimal, rounded to two decimal places. Do the initial (untested) findings show what the researcher expected? Enter your answer as a list of 3 items: P1, P2, yes or no. Do not add any extra spaces and pay attention to rounding. For example, a valid answer may look like .52,.14,yes or .25,.50,no. Untested, you compared them but you could have done that…arrow_forward
arrow_back_ios
arrow_forward_ios
Recommended textbooks for you
- MATLAB: An Introduction with ApplicationsStatisticsISBN:9781119256830Author:Amos GilatPublisher:John Wiley & Sons IncProbability and Statistics for Engineering and th...StatisticsISBN:9781305251809Author:Jay L. DevorePublisher:Cengage LearningStatistics for The Behavioral Sciences (MindTap C...StatisticsISBN:9781305504912Author:Frederick J Gravetter, Larry B. WallnauPublisher:Cengage Learning
- Elementary Statistics: Picturing the World (7th E...StatisticsISBN:9780134683416Author:Ron Larson, Betsy FarberPublisher:PEARSONThe Basic Practice of StatisticsStatisticsISBN:9781319042578Author:David S. Moore, William I. Notz, Michael A. FlignerPublisher:W. H. FreemanIntroduction to the Practice of StatisticsStatisticsISBN:9781319013387Author:David S. Moore, George P. McCabe, Bruce A. CraigPublisher:W. H. Freeman

MATLAB: An Introduction with Applications
Statistics
ISBN:9781119256830
Author:Amos Gilat
Publisher:John Wiley & Sons Inc

Probability and Statistics for Engineering and th...
Statistics
ISBN:9781305251809
Author:Jay L. Devore
Publisher:Cengage Learning

Statistics for The Behavioral Sciences (MindTap C...
Statistics
ISBN:9781305504912
Author:Frederick J Gravetter, Larry B. Wallnau
Publisher:Cengage Learning

Elementary Statistics: Picturing the World (7th E...
Statistics
ISBN:9780134683416
Author:Ron Larson, Betsy Farber
Publisher:PEARSON

The Basic Practice of Statistics
Statistics
ISBN:9781319042578
Author:David S. Moore, William I. Notz, Michael A. Fligner
Publisher:W. H. Freeman

Introduction to the Practice of Statistics
Statistics
ISBN:9781319013387
Author:David S. Moore, George P. McCabe, Bruce A. Craig
Publisher:W. H. Freeman