Let p be the population proportion of correct polygraph results. Identify the null and alternative hypotheses. Choose the correct answer below. O A. Ho: p=0.80 H₁: p>0.80 OC. Ho: p=0.20 H₁: p>0.20 O E. Ho: p=0.20 H₁: p0.20 The test statistic is z = (Round to two decimal places as needed.) OB. Ho: p=0.80 H₁: p *0.80 O D. Ho: p=0.20 H₁: p<0.20 F. Ho: p=0.80 H₁: p<0.80
Let p be the population proportion of correct polygraph results. Identify the null and alternative hypotheses. Choose the correct answer below. O A. Ho: p=0.80 H₁: p>0.80 OC. Ho: p=0.20 H₁: p>0.20 O E. Ho: p=0.20 H₁: p0.20 The test statistic is z = (Round to two decimal places as needed.) OB. Ho: p=0.80 H₁: p *0.80 O D. Ho: p=0.20 H₁: p<0.20 F. Ho: p=0.80 H₁: p<0.80

MATLAB: An Introduction with Applications
6th Edition
ISBN:9781119256830
Author:Amos Gilat
Publisher:Amos Gilat
Chapter1: Starting With Matlab
Section: Chapter Questions
Problem 1P

Related questions
Question
P VALUE FOR TEST HYPOTHESIS
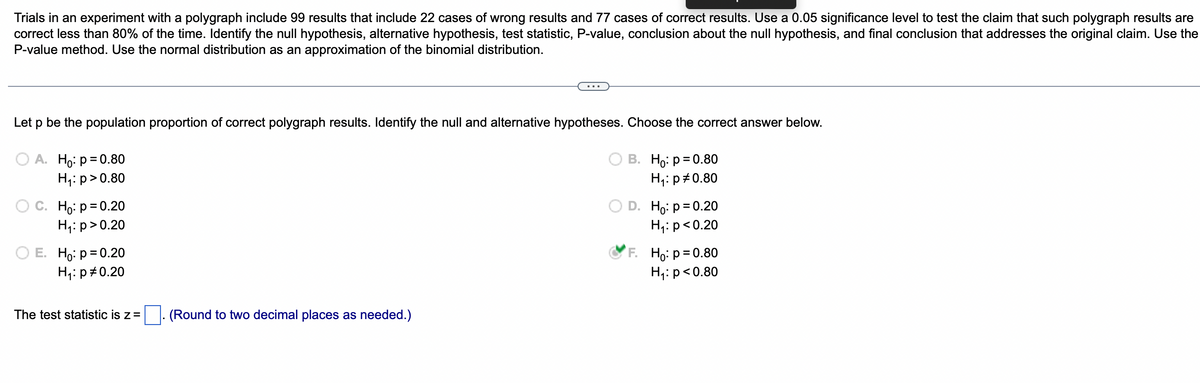
Transcribed Image Text:Trials in an experiment with a polygraph include 99 results that include 22 cases of wrong results and 77 cases of correct results. Use a 0.05 significance level to test the claim that such polygraph results are
correct less than 80% of the time. Identify the null hypothesis, alternative hypothesis, test statistic, P-value, conclusion about the null hypothesis, and final conclusion that addresses the original claim. Use the
P-value method. Use the normal distribution as an approximation of the binomial distribution.
Let p be the population proportion of correct polygraph results. Identify the null and alternative hypotheses. Choose the correct answer below.
OA. Ho: p=0.80
H₁: p > 0.80
O C. Ho: p=0.20
H₁: p>0.20
E. Ho: p=0.20
H₁: p0.20
The test statistic is z = . (Round to two decimal places as needed.)
B. Ho: p=0.80
H₁: p=0.80
D. Ho: p=0.20
H₁: p<0.20
F. Ho: p=0.80
H₁: p<0.80
Expert Solution
This question has been solved!
Explore an expertly crafted, step-by-step solution for a thorough understanding of key concepts.

This is a popular solution!

Trending now
This is a popular solution!

Step by step
Solved in 3 steps

Recommended textbooks for you
MATLAB: An Introduction with Applications
Statistics
ISBN:
9781119256830
Author:
Amos Gilat
Publisher:
John Wiley & Sons Inc

Probability and Statistics for Engineering and th…
Statistics
ISBN:
9781305251809
Author:
Jay L. Devore
Publisher:
Cengage Learning

Statistics for The Behavioral Sciences (MindTap C…
Statistics
ISBN:
9781305504912
Author:
Frederick J Gravetter, Larry B. Wallnau
Publisher:
Cengage Learning
MATLAB: An Introduction with Applications
Statistics
ISBN:
9781119256830
Author:
Amos Gilat
Publisher:
John Wiley & Sons Inc
Probability and Statistics for Engineering and th…
Statistics
ISBN:
9781305251809
Author:
Jay L. Devore
Publisher:
Cengage Learning
Statistics for The Behavioral Sciences (MindTap C…
Statistics
ISBN:
9781305504912
Author:
Frederick J Gravetter, Larry B. Wallnau
Publisher:
Cengage Learning

Elementary Statistics: Picturing the World (7th E…
Statistics
ISBN:
9780134683416
Author:
Ron Larson, Betsy Farber
Publisher:
PEARSON

The Basic Practice of Statistics
Statistics
ISBN:
9781319042578
Author:
David S. Moore, William I. Notz, Michael A. Fligner
Publisher:
W. H. Freeman

Introduction to the Practice of Statistics
Statistics
ISBN:
9781319013387
Author:
David S. Moore, George P. McCabe, Bruce A. Craig
Publisher:
W. H. Freeman