Level of education Gender Crosstabulation Gender Male Female Total Level of education O-L Count 162 95 257 % within Level of education 63.0% 37.0% 100.0% % of Total 34.5% 20.2% 54.7% A-L Count 86 40 126 % within Level of education 68.3% 31.7% 100.0% % of Total 18.3% 8.5% 26.8% General Degree Count 40 18 58 % within Level of education 69.0% 31.0% 100.0% % of Total 8.5% 3.8% 12.3% Honours Degree Count 16 9 25 % within Level of education 64.0% 36.0% 100.0% % of Total 3.4% 1.9% 5.3% Postgraduate degree Count 4 4 % within Level of education 100.0% 0.0% 100.0% % of Total 0.9% 0.0% 0.9% Total Count 308 162 470 % within Level of education 65.5% 34.5% 100.0% % of Total 65.5% 34.5% 100.0%
Q: Gender difference in basketball shooting ability being due to the size of the ball is a case of:…
A: The factors which negatively affect the external validity of an experimental design are…
Q: ratings data quality of the speed of execution and overall satiSraction with electronic trades…
A: Given: estimated regression equation y = 0.5675 + 0.8206x First enter this data into ExcelNow,
Q: Total Grades Both Sexes Female Male No. Kindergarten 75,384 37,183 38,201 Basic education First…
A: The following data is given Grades Both sexes Females Males Kinder garden 75384…
Q: Position of bulldozer in cm. (x) Trials Experiment #1 Time in seconds (t) Trials Experiment #2 1 1…
A: Find the slope from the graph. The slope is given as m=y2-y1x2-x1.
Q: The data for this project is in data frame Pseudoscorpions, from package abd: require(abd)
A: Given information: Given that the investigator is interested to study whether the female…
Q: Ambient temperatures (°C) of the sites where the extremophilic bacterium species Deinococcus…
A: From the provided information, the ambient temperature that can be concluded to be an extreme…
Q: Sample Problem An article in the Journal of Soundand Vibration (1991, Vol. 151, pp. 383-394)…
A: We have given data for blood pressure rise according to sound pressure. We have to draw scatter…
Q: Engineerig statistics: A civil engineer is planning an experiment to compare the levels of…
A: An experiment is to compare the levels of biological oxygen demand (B.O.D.) at three different…
Q: Design Cost Durability Shape Comfort A 10000 92 0 0 B 12672 32 100 8 C 17000 0 29…
A: 1a. What would the normalized weights for each benefit? Benefits Design Cost Durability…
Q: Data Points: x = -2.0 cm x = -6.0 cm Voltage (V) 4.0 x = 0 cm Voltage (V) 3.5 x = -4.0 cm y (cm)…
A: 1.The given data points are,
Q: For ungroup data: Mean Median Mode
A: As per Bartleby guidelines , we are allowed to answer three sub-parts of a question, Please ask…
Q: STATE OF NATURE FAVORABLE UNFAVORABLE ERNATIVE MARKET ($) MARKET ($) struct a large plant 785,800…
A: Emv stands for expected monetary value and is calculated by multiplying each alternative with…
Q: IQ is normally distributed with a mean of 100 and a standard deviation of 15. Use the Cumulative…
A: Let X denote the IQ and it follows normal distribution with mean μ=100, and standard deviation of…
Q: Two factors in a manufacturing process for an integrated circuit are studied in a two-factor…
A: Two way ANOVA : A 2-way analysis of variance take a look at could be a applied math take a look at…
Q: Weight Range(frams) Percent of Sample (%) 20 - 40 10 40 - 60 10 60 - 80 20 80 - 100 10 100…
A: Consider the provided data that shows the distribution of weights of a sample of fleegs. Weight…
Q: inear Regression Application, Interpolation and Extrapolation Use the data and story to answer the…
A: The general regression line is y = mx + b.
Q: Independent Activity 1: COMPLETE MY LIST The COVID-19 pandemic tested Filipino's resourcefulness and…
A: Given that: 4 sweet goods: Minasa(M), Ensaymada(E), Inipit(I), Pastillas(P) 2 Beverages: Salabat(S),…
Q: Regression StatisticsMultiple R 0.890579188 Business Administration Program Final Assessment…
A: A multiple regression analysis is used when two or more independent variables are used to predict a…
Q: Optical Density (OD) of Colored Filtrate (Reflects Amount of Bile Acid in Filtrate) 1- OD (Reflects…
A: table 1 Optical Density (OD) experimental trials Bile acid with buffer solution(no…
Q: Please see attached to answer the following. a. Calculate the sample mean and the sample standard…
A:
Q: control Ratio Test Ontic a) 001 S (2j)! j=₁ (3j)!) Jaj im 2200 2245 lox2 09-02 Root test G (im Sup…
A:
Q: Income ($ billions) Disposable income is the amount left after taxes have been paid and is one…
A: Given Data : Let X = number of years after 2000 Y = Total disposable income X Y 2010 10.436…
Q: Source DF SS MS F P Type 1 36360 36360.1 2.42 0.146 Size 2 14396 7198.2 0.48 0.630 Interaction 2…
A: Given 2-way ANOVA table is : Source DF SS MS F P Type 1 36360 36360.1…
Q: Iron is an integral part of many proteins and enzymes that maintain good health. Recommendations for…
A: Claim: A hypothesis test is to be performed to decide whether adults females under the age of 51…
Q: Required information The removal of ammoniacal nitrogen is an important aspect of treatment of…
A: Given, the treatments are as follows, Rate of removal A 5.21 4.65 B 5.59 2.69 7.57 5.16…
Q: Micromedia offers computer training seminars on a variety of topics. In the seminars each student…
A: Note : According to our guidelines we can answer only first three subparts Micromedia offers…
Q: Three different types of coupling units are produced by a firm. The times required for machining,…
A:
Q: 32. A television station is interested in predicting whether voters are in favor of an increase in…
A:
Q: Site A Site B mployees Observation Residual z score Employees Observation Residual z score 1 45 -9.6…
A: a) For site A, for person 4, we are given the observation value as 42 and not 0.02, therefore this…
Q: llustration 7.4. Represent the following data by a suitable dia- gram. Also indicate the 'profit' or…
A:
Q: What is the answer to question 10.8 compute column percentages to identify the pattern of the…
A: The column percentages are, The null and the alternative hypotheses used for testing are, H0:…
Q: Pair Dependent (Y) Independent (X) 1. Employability and Educational Attainment 2. Diseases and…
A: Independent Variables: In a research study, the variables which are used to predict the outcome are…
Q: Company A Company B Company C 1.001 g 0.998 g 0.999 g 1.000 g. 2.863 g 2.444 g 2.186 g 1.015 g 1.015…
A: *answer: answers Precision and accuracy are the metrics that provide reliability to the…
Q: At Symbiotech, the output of a process is valued at $110 per unit. The cost of labor is $50 per hour…
A:
Q: 16. Calcium is an essential nutrient for strong bones and for controlling blood pressure and hear…
A: Note: "Since you have asked multiple question, we will solve the first question for you. If you want…
Q: P-value = State your conclusion. Reject Ho. We have convincing evidence that more than a quarter of…
A: Given data number of success , x= 78 sample size, n =282 population proportion,p=…
Q: Buteyko Method questions.
A: a. As the researchers conduct the study to determine whether the Buteyko method helps to reduce…
Q: population as a percentage of the total population. One model to test for a relationship is…
A: Given model is as below log(rent) = βo + β1 log(pop) + β2 log(avginc) + β3 pctstu + u where pop…
Q: population Height x P (x) x∙P(x) x2 x2 ∙ p(x) 54 inches 0.05 2.7 2916 145.8 58 inches…
A: We know that, Mean = (summation f*x)/(summation f) And standard deviation= √E(X2)-mean2 E(X2)=…
Q: Hello, I am trying to derive regression equation from the data. I already made the graph that…
A: Given data and calculation for equation of regression line is shown below
Q: Subprime Mortgage Debt during the Housing Bubble (Compare Exercise 104.) During the real estate…
A:
Q: Sample Problem An article in the Journal of Soundand Vibration(1991, Vol. 151, pp. 383-394)…
A: Since you have posted a question with multiple sub-parts, we will solve first three sub- parts for…
Q: MONTH | ACTIVITY | COST $6,250 8,600 9,200 6,750 10,000 8,000 8,000 6,000 January February March 525…
A: *Answer:
Q: Full data setD Uncarpeted 12.5 A researcher wanted to determine if carpeted rooms contain more…
A:
Q: Question: A response variable has two possible explanatory variables, X₁ and X₂. Three linear models…
A: Akaike Information Criterion is a measure that estimates the amount of information lost by the given…
Q: Population size (Thousands of Residents). Yearly Revenue, Y (Thousands of Dollars) The Tasty Sub…
A:
Q: Clocking the Cheetah. The cheetah (Acinonyx jubatus)isthe fastest land mammal and is highly…
A: The random variable top speed follows normal distribution. We have to construct 95% confidence…
Q: At Symbiotech, the output of a process is valued at $110 per unit. The cost of labor is $50 per hour…
A: Given The unit produced in week 4 = 985 Labor cost in $=9576 The cost of labor is $50 per hour…
Explain the all the result in table usnig frequencies and percentages
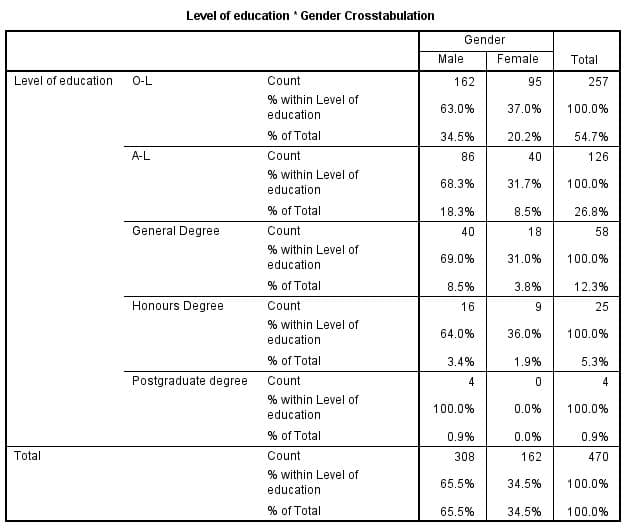
Step by step
Solved in 2 steps
- Cholesterol Cholesterol in human blood is necessary, but too much can lead to health problems. There are three main types of cholesterol: HDL (high-density lipoproteins), LDL (low-density lipoproteins), and VLDL (very low-density lipoproteins). HDL is considered “good” cholesterol; LDL and VLDL are considered “bad” cholesterol. A standard fasting cholesterol blood test measures total cholesterol, HDL cholesterol, and triglycerides. These numbers are used to estimate LDL and VLDL, which are difficult to measure directly. Your doctor recommends that your combined LDL/VLDL cholesterol level be less than 130 milligrams per deciliter, your HDL cholesterol level be at least 60 milligrams per deciliter, and your total cholesterol level be no more than 200 milligrams per deciliter. (a) Write a system of linear inequalities for the recommended cholesterol levels. Let x represent the HDL cholesterol level, and let y represent the combined LDL VLDL cholesterol level. (b) Graph the system of inequalities from part (a). Label any vertices of the solution region. (c) Is the following set of cholesterol levels within the recommendations? Explain. LDL/VLDL: 120 milligrams per deciliter HDL: 90 milligrams per deciliter Total: 210 milligrams per deciliter (d) Give an example of cholesterol levels in which the LDL/VLDL cholesterol level is too high but the HDL cholesterol level is acceptable. (e) Another recommendation is that the ratio of total cholesterol to HDL cholesterol be less than 4 (that is, less than 4 to 1). Identify a point in the solution region from part (b) that meets this recommendation, and explain why it meets the recommendation.A shoe wholesaler wants to optimize its shipment of shoes to its client retailers. To minimize their turnover time and avoid building up stocks that add costs, the wholesaler wants to know if weather conditions are important in determining the type of shoe demanded. Specifically, she / he would like to know if high temperatures affect the sale of closed, rubber-heeled walking shoes. He / she has the relevant data showing the temperature recorded at the location of its retail shops, as well as their record of sales of these walking shoes, during each day of the past year. What type of analysis should he / she conduct? What variables should be considered? Explain.French Biscuit Manufacturer (FBM), produces two types of biscuits (i) double chocolate biscuitsand (ii) tea time biscuits in two separate manufacturing units. They are interested in expandingthe manufacturing units (one by one) because there is a demand in the market but facing adifficulty to decide which manufacturing unit should expand first. Company officials decidedthat the expansion decision was based upon monthly demand.FBM official consults you and requests to give your valuable suggestion which will be helpfulfor final decision. you analyzed the following normally distributed data: Monthly Sale of BiscuitsDoubleChocolate 8551 6314 5259 8138 8429 4807 8025 6845 6478 75139125 4894 9106 8775 10070 7845 6229 8459 10542 4196 Tea Time 10247 6601 7404 8919 9255 8404 6304 7803 11474 913113345 8118 6713 7439 10957 12098 9134 7535 10316 8125 Kindly provide the following information regarding your data analysis.a. Write the null and alternative hypothesis.b. Determine the…
- Reference: Camm J.D. et al., (2019) Business Analytics: descriptive, predictive and prescriptive (3rd edition). Cengage ____________________________________________________________________________________ Jay Gatsby categorizes wines into one of three clusters. The centroids of these clusters, describing the average characteristics of a wine in each cluster, are listed in the following table. Characteristic Cluster 1 Cluster 2 Cluster 3 Alcohol 0.819 0.164 -0.937 MalicAcid -0.329 0.869 -0.368 Ash 0.248 0.186 -0.393 Alcalinity…Floyd Distributors, Inc., provides a variety of auto parts to small local garages. Floyd purchases parts from manufacturers according to the EOQ model and then ships the parts from a regional warehouse direct to its customers. For a particular type of muffler, Floyd's EOQ analysis recommends orders with Q* = 20 to satisfy an annual demand of 180 mufflers. Floyd's has 250 working days per year, and the lead time averages 15 days.Note: Use Appendix B to identify the areas for the standard normal distribution. What is the reorder point if Floyd assumes a constant demand rate? If required, round your answer up to the nearest whole number. r = fill in the blank 1 Suppose that an analysis of Floyd's muffler demand shows that the lead-time demand follows a normal probability distribution with µ = 12 and σ = 2.2. If Floyd's management can tolerate one stock-out per year, what is the revised reorder point? If required, round your answer up to the nearest whole number. r = fill in the blank…PCBs and Pelicans. Polychlorinated biphenyls (PCBs), industrial pollutants, are known to be carcinogens and a great danger to natural ecosystems. As a result of several studies, PCB production was banned in the United States in 1979 and by the Stockholm Convention on Persistent Organic Pollutants in 2001. One study, published in 1972 by R. Risebrough, is titled “Effects of Environmental Pollutants Upon Animals Other Than Man” (Proceedings of the 6th Berkeley Symposium on Mathematics and Statistics, VI, University of California Press, pp. 443–463). In that study, 60 Anacapa pelican eggs were collected and measured for their shell thickness, in millimeters (mm), and concentration of PCBs, in parts per million (ppm). The data are on the WeissStats site. a. obtain and interpret the standard error of the estimate. b. obtain a residual plot and a normal probability plot of the residuals. c. decide whether you can reasonably consider Assumptions 1–3 for regression inferences met by the two…
- Acupuncture. Research reported in 2008 brings to lightthe effectiveness of treating chronic lower back pain withdifferent methods. One-third of nearly 1200 volunteers were administered conventional treatment (drugs, physi-cal therapy, and exercise). The remaining patients got 30-minute acupuncture sessions. Half of these patientswere punctured at sites suspected of being useful andhalf received needles at other spots on their bodies.Comparable shares of each acupuncture group, roughly45%, reported decreased back pain for at least six monthsafter their sessions ended. This was almost twice as highas those receiving the conventional therapy, leading theresearchers to conclude that results were statisticallysignificant.a) Why did the researchers feel it was necessary to havesome of the patients undergo a “fake” acupuncture?b) Because patients had to consent to participate in thisexperiment, the subjects were essentially self-selected—a kind of voluntary response group. Explain why…8 Selling electric power. Researchers for the University ofMaryland Department of Civil and Environmental Engineering used stochastic dynamic programming to determine optimal load estimates for electric power (Journal ofEnergy Engineering, Apr. 2004). One objective was to determine the probability that a supplier of electric powerwould reach or exceed a specific net profit goal for variedload estimates. All load estimates in the study yielded aprobability of .95. Consider two different suppliers of electric power (Supplier A and Supplier B) acting independently.a. What is the probability that both suppliers reach theirnet profit goal?b. What is the probability that neither supplier reaches itsnet profit goal?c. What is the probability that either Supplier A or SupplierB reaches its net profit goal?choose one of the following procedures for each of the research scenarios described. In a rural school 202 students from a total school population of 723 suffer from malnutrition while in an urban school, 167 students from a total of 1 001 suffer from malnutrition. A master’s degree student wants to determine whether suffering from malnutrition is dependent on the region (urban versus rural) in which the school is situated.
- PCBs and Pelicans. Polychlorinated biphenyls (PCBs), industrial pollutants, are known to be carcinogens and a great danger to natural ecosystems. As a result of several studies, PCB production was banned in the United States in 1979 and by the Stockholm Convention on Persistent Organic Pollutants in 2001. One study, published in 1972 by R. W. Risebrough, is titled ‘‘Effects of Environmental Pollutants Upon Animals Other Than Man’’ (Proceedings of the 6th Berkeley Symposium on Mathematics and Statistics, VI, University of California Press, pp. 443–463). In that study, 60 Anacapa pelican eggs were collected and measured for their shell thickness, in millimeters (mm), and concentration of PCBs, in parts per million (ppm). Following is a relative-frequency histogram of the PCB concentration data.Stores, a division of National Clothing, is a chain of women’s apparel stores operating throughout the country. The chain recently ran a promotion in which discount coupons were sent to customers of other National Clothing stores. Data collected for a sample of 100 in-store credit card transactions at Pelican Stores during one day while the promotion was running are contained in the file PelicanStores. Table 3.13 shows a portion of the data set. The Proprietary Card method of payment refers to charges made using a National Clothing charge card. Customers who made a purchase using a discount coupon are referred to as promotional customers and customers who made a purchase but did not use a discount coupon are referred to as regular customers. Because the promotional coupons were not sent to regular Pelican Stores customers, management considers the sales made to people presenting the promotional coupons as sales it would not otherwise make. Of course, Pelican also hopes that the…A researcher's survey results indicate that about 50% of 12th graders consume less than 300g of vegetables at lunch, about 40% consume 300-600g, and only 10% of them consume more than 600g. A high school conducted a survey of student diets and health information, and reported data about 12th graders' vegetable intake at lunch is reported in the table photo. If researchers wants to find out whether the high school has the same proportions of 12th graders in the vegetable intake categories as reported by the survey, what would the appropiate test statistic be to use and why. Choosing between an ANOVA, Chi -Square independence tests, Chi Square Goodness of Fit, and One sample proportion test?